16S/18S/ITS Amplicon Sequencing
Home
> 16S/18S/ITS Amplicon Sequencing
16S/18S/ITS Amplicon Sequencing for Microbial Diversity (50k+ Reads)
CD Genomics offers highly efficient, sensitive, and cost-effective 16S/18S/ITS amplicon sequencing services, facilitating the classification and community structure analysis of bacteria, archaea, and fungi.
CD Genomics provides accurate and cost-effective amplicon sequencing for bacteria, archaea, and fungi. Our platform supports diverse applications in environmental science, agriculture, industry, and healthcare.
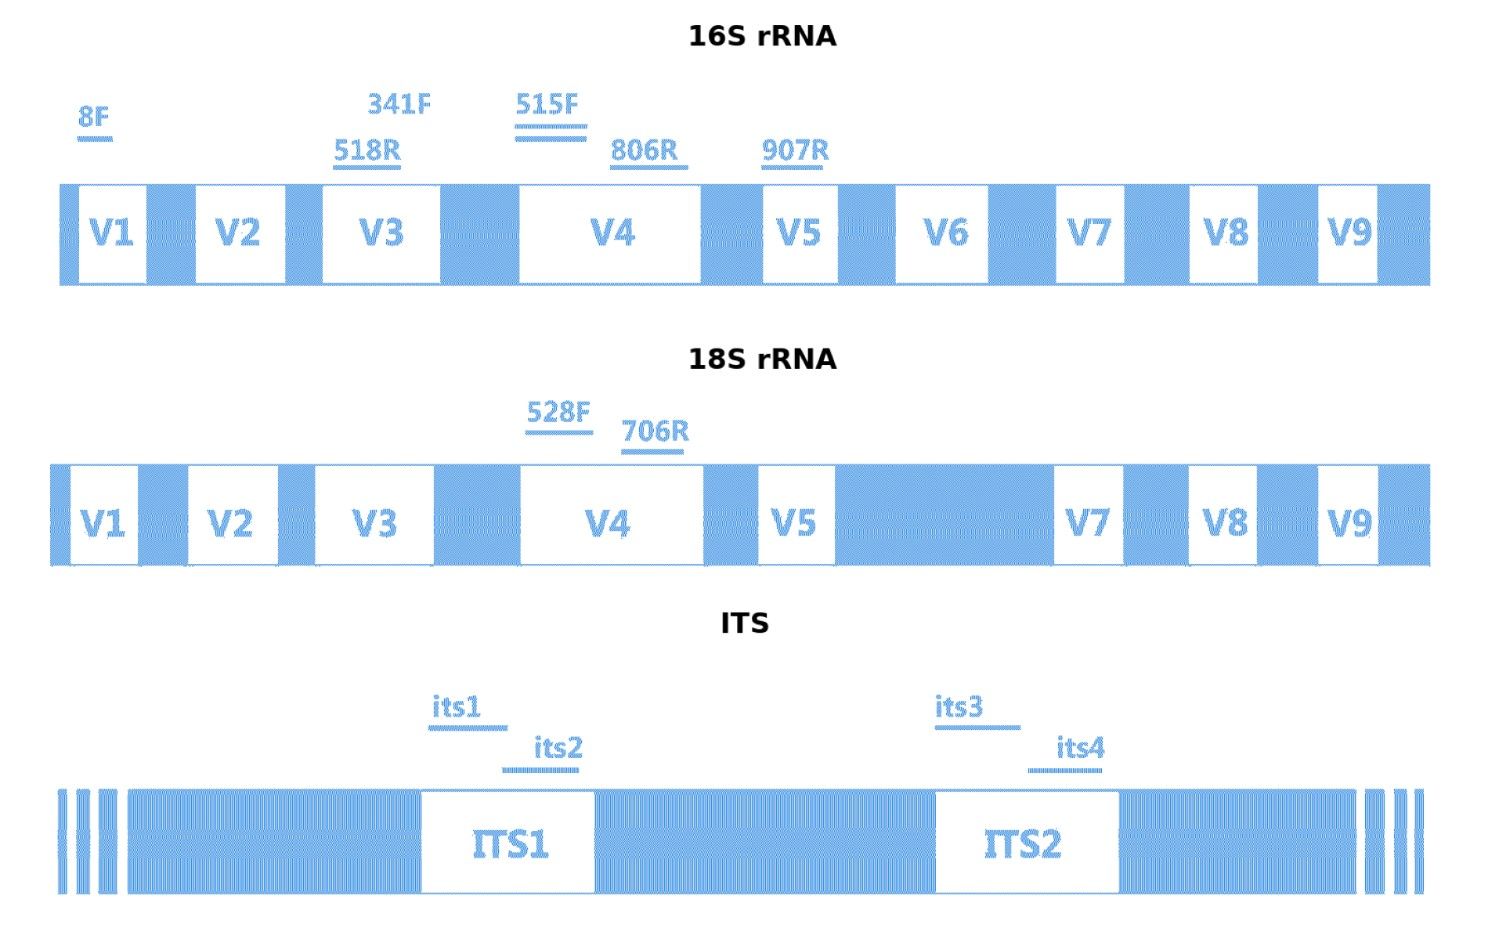
16S Sequencing Targets the 16S rRNA gene, present in bacteria and archaea, featuring nine hypervariable regions for detailed microbial identification. By sequencing regions like V3–V4 or V4–V5, we classify microbes from broad groups down to species level. This method is ideal for microbiome analysis, environmental monitoring, and detecting microbial bioindicators.
18S Sequencing Focuses on the 18S rRNA gene found in eukaryotes including protists, fungi, and plants. Although more conserved than 16S, it effectively distinguishes major eukaryotic groups. Common applications include studying soil and water eukaryotic microbes, biodiversity assessments, and ecological research.
ITS Sequencing Amplifies the highly variable ITS region, critical for fungal species identification. ITS sequencing excels at differentiating fungi with high precision and is widely used for identifying edible and medicinal fungi, detecting pathogens, and tracing contamination in food and environment.
Target Regions and Common Amplification Primers for 16S rRNA, 18S rRNA, and ITS
16S vs 18S vs ITS: Which Marker Should You Use?
Not sure which marker fits your community and sample type? Use the quick comparison below to avoid choosing a region that misses your target taxa or reduces resolution.
Marker
Best for
Main targets
Typical resolution
Common region choice
Key caveat (pain point)
16S rRNA
Bacterial/archaeal community profiling
Bacteria, Archaea
Genus to species (depends on region)
V3–V4 / V4–V5
Primer/region choice can shift observed composition; species-level may be limited for some taxa
18S rRNA
Eukaryotic microbiome overview
Protists, algae, some fungi/plants
Often higher-level eukaryotic groups
SSU region
Less variable → may under-resolve closely related eukaryotes
ITS (ITS1/ITS2)
Fungal community and species ID
Fungi
Often species-level for fungi
ITS1 or ITS2
Length/GC variability can bias amplification; choose ITS1 vs ITS2 by sample and study goal
Quick pick
If your primary goal is bacteria/archaea diversity → choose 16S.
If you need protists/algae/eukaryotic diversity → choose 18S.
If you need fungal species profiling → choose ITS (ITS1/ITS2).
Why Choose Amplicon Sequencing?
Amplicon sequencing offers a smart, efficient alternative to traditional culturing or full metagenomic sequencing — especially for large-scale or complex microbial studies.
Fast, Accurate Microbial ID: Detects diverse species with higher accuracy than traditional culturing.
High Sensitivity & Throughput: Delivers 50,000+ reads/sample — ideal for low-abundance microbes in complex samples.
Species-Level Resolution: ASV-based analysis (e.g., DADA2) offers finer taxonomic precision than OTU clustering.
Cost-Effective Targeting: Focuses on key gene regions to reduce sequencing and analysis costs.
Rapid Turnaround: Amplicon sequencing enables fast data generation and reporting.
Amplicon Sequencing Targets & Applications at a Glance
Amplicon sequencing is a powerful tool for profiling microbial communities across diverse sample types and research goals. The table below outlines typical targets and application scenarios for each sequencing type.
• Fungal taxonomy profiling • Edible and medicinal fungi identification • Plant and animal pathogen detection • Food and pharmaceutical contamination tracing • Agricultural soil fertility studies
16S/18S/ITS Amplicon Sequencing Service Options
We offer three main sequencing options based on research needs:
Standard 16S/18S/ITS Sequencing
Targeted regions | Genus/species-level | Cost-effective
Detailed Parameters ↓
Full-Length 16S/18S/ITS Amplicon Sequencing
Comprehensive profiling | Species/strain-level | High phylogenetic accuracy
Explore Full-Length Service →
Absolute Quantitative 16S/18S/ITS Sequencing
qPCR + Sequencing | Accurate abundance | For quantitative microbiome studies
Explore Absolute Quant Service →
Standard vs Full-Length vs Absolute Quantitative Amplicon Sequencing
Not sure which option fits your study? The key difference is whether you need a cost-efficient relative profile, higher taxonomic resolution, or absolute abundance to track true microbial load changes.
Comparison Table
Option
What it measures
Best for
What you gain
Note / trade-off
Standard (short-region amplicon)
Relative abundance from a commonly used region (e.g., 16S V3–V4; ITS1/ITS2; 18S region)
Large cohorts, routine community comparisons, discovery screening
Requires appropriate quantification design and QC; results depend on sample matrix and calibration
Quick pick (at a glance)
Choose Standard if you mainly need community structure and between-group comparisons.
Choose Full-Length if you need higher taxonomic resolution for complex samples.
Choose Absolute Quantitative if you need to measure true abundance changes, not only relative proportions (RUO).
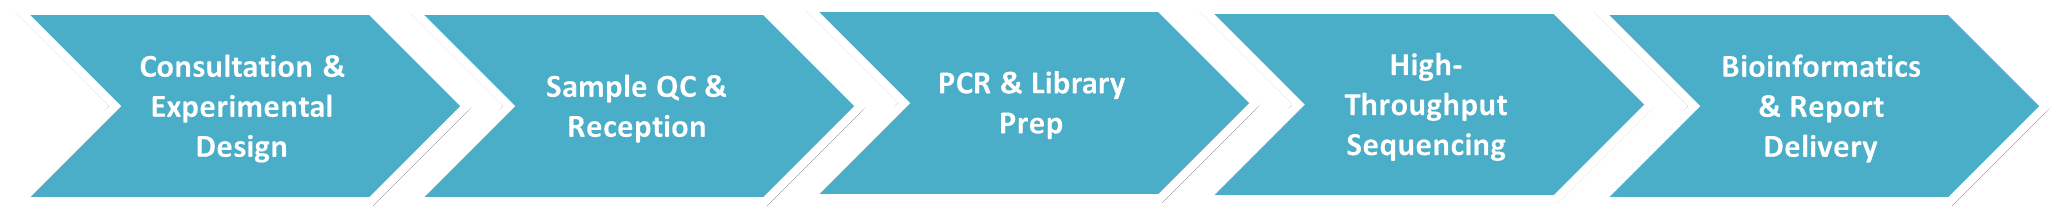
End-to-End 16S/18S/ITS Sequencing Workflow
We provide a comprehensive, one-stop service covering the entire workflow—from sample preparation to data analysis—ensuring both data quality and research efficiency.
• Total ≥ 100 ng • Concentration ≥ 10 ng/μL • Recommended OD260/280 between 1.8–2.0
Genomic DNA
• Total ≥ 100 ng • Concentration ≥ 1 ng/μL • Must be free of RNA and protein contamination
PCR Products
• Total ≥ 3 μg • Concentration ≥ 10 ng/μL • Must be purified; please provide amplicon length and primer sequence information
Raw Samples (e.g., soil, water, sediment)
• Recommended: ≥ 5 g for wet samples, ≥ 2 g for dry samples, or ≥ 5 mL for liquid samples • Ensure sterile packaging and cold chain transport
Shipping Instructions: Samples must be shipped with light protection and under cold conditions (preferably on dry ice or stored at −80°C).
Note: For other sample types, please contact us for a customised protocol.
Why Choose CD Genomics Amplicon Sequencing?
Advanced amplicon sequencing solutions trusted by 500+ global institutes for actionable microbiome insights.
Capture Rare Taxa: Detect microbes as low as 0.01% abundance (≥50,000 reads/sample).
Multi-Region Flexibility: Optimized primers for V3-V4 (bacteria), ITS2 (fungi), and custom regions.
Fast Results: Reports delivered quickly to support your research timeline.
Publication Support: LEfSe, PCoA, and heatmaps formatted for Nature Microbiology guidelines.
Demo Results
These demo figures illustrate typical bioinformatics deliverables—rarefaction/depth QC, alpha/beta diversity (PCoA/NMDS), taxonomy profiles, and differential abundance (LEfSe)—formatted for publication-ready reporting.
Phylum-level taxonomy composition
Species abundance heatmap
Rarefaction curve and sequencing depth
Beta diversity distance boxplots
PCoA plots for beta diversity
UPGMA clustering dendrogram
Group-wise relative abundance summary
LEfSe cladogram
LEfSe LDA score bar chart
16S/18S/ITS Amplicon Seq FAQs
1. How do I choose the right amplicon region (e.g., V3–V4, ITS2) for my sequencing project?
The ideal region depends on your sample type and research goal. Below are common use-case recommendations:
Gut microbiome (human or animal): Use V3–V4 for broad microbial coverage and balanced taxonomic resolution.
Oral or skin microbiota: Try V1–V3 or V1–V2 to better distinguish dominant surface-associated bacteria.
Soil, water, or other environmental samples: Choose V3–V4 or V4–V5, both effective for high-diversity microbial communities.
Fungal profiling: Use ITS2 for general fungal community studies, or ITS1 when analyzing air or plant-associated fungi.
Eukaryotic microbes (e.g., protists): The 18S rRNA SSU region is preferred for soil and aquatic samples.
✅ These are starting points — the best choice ultimately depends on your taxonomic resolution needs and study design. We recommend a brief consultation during project planning to select the most appropriate region and primers.
2. Do I need to include biological replicates? If so, how many?
Yes — replicates are highly recommended, especially for studies involving statistical comparisons or differential abundance analysis.
Minimum suggestion: At least 3 biological replicates per group for standard LEfSe or ANOSIM tests.
For complex or heterogeneous samples: Use 5–6 replicates to improve data reliability and capture community variability.
3. What if my sample quantity or quality doesn't meet requirements?
All incoming samples undergo quality checks. If the DNA is too low in concentration or purity, we'll alert you and suggest alternatives.
Low-yield rescue: In many cases, we can offer optimized protocols for limited samples — contact our support team for options.
4. Can you process difficult or unconventional sample types?
Absolutely. We routinely handle:
Soil, sediment, and sludge
Water (fresh or marine)
Faeces, swabs (skin, nasal), fermentation broths
Other high-contamination or low-biomass samples
⚠️ For extreme environments or low-abundance communities, let us know in advance — we'll tailor the workflow accordingly.
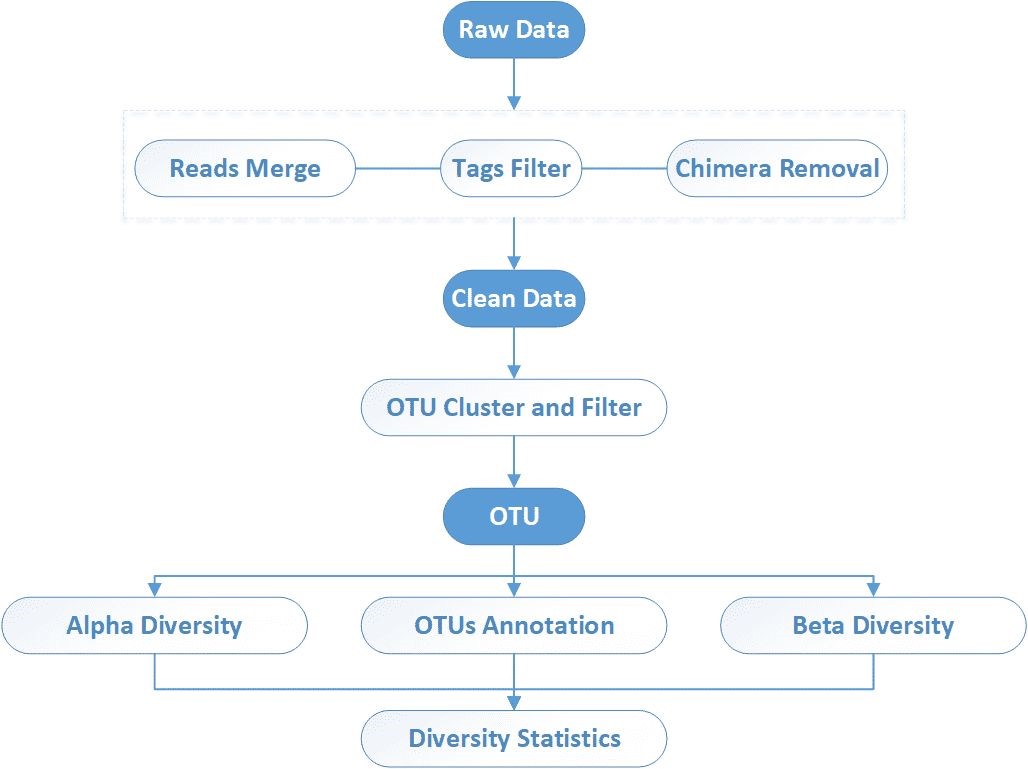
5. Is the bioinformatics analysis customisable?
Yes. Our standard pipeline includes:
Sequence quality control
Taxonomic annotation
α- and β-diversity metrics
Differential abundance (e.g., LEfSe)
For advanced requests — like metabolic pathway prediction, network analysis, or absolute quantification — we offer bespoke analysis packages. Pricing and timelines are quoted case by case.
6. Can I send multiple samples at once? Will they contaminate each other?
Yes, we support high-throughput processing of multiple samples. Each sample is barcoded with a unique identifier.
7. Do I need to supply primers, or are they provided?
We typically provide validated primer sets optimised for commonly used regions like V3–V4 or ITS2. If you need a custom region or primer design, simply share the target and we'll assist with optimization and synthesis.
8: What is the difference between relative and absolute abundance in amplicon sequencing?
Relative abundance shows the proportion of taxa within a sample, while absolute abundance estimates calibrated load (e.g., copies per unit sample) to help distinguish true biomass changes from compositional shifts.