CAR-T Single-Cell Multiomics Solution
Home
> CAR-T Single-Cell Multiomics Solution
CAR-T Single-Cell Multiomics Solution
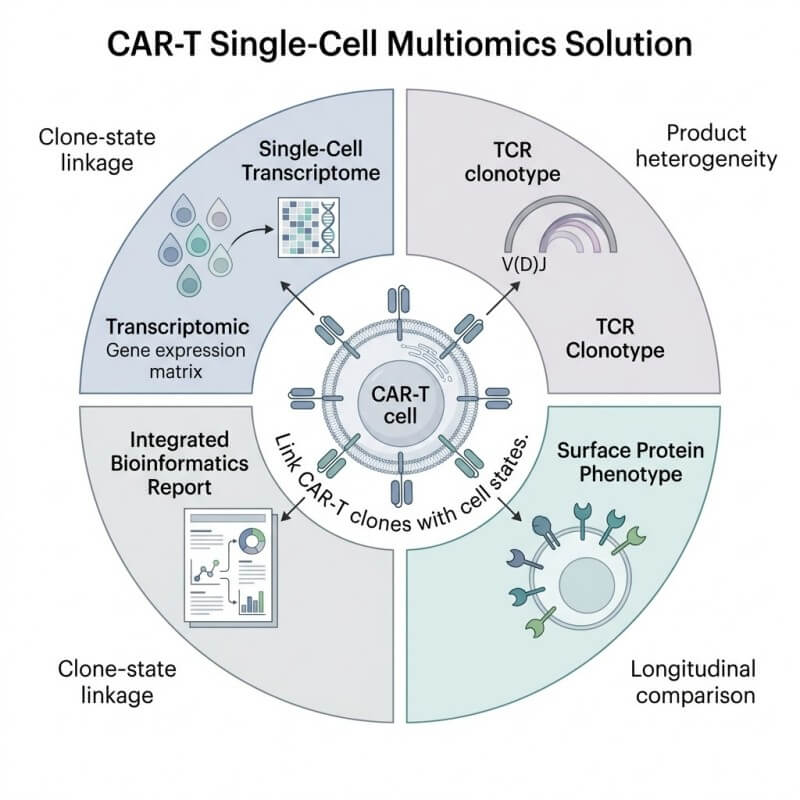
CAR-T single-cell multiomics connects clone identity, cell state, phenotype, and sample context at single-cell resolution. CD Genomics helps R&D teams study product heterogeneity, clonotype dynamics, functional states, persistence, and resistance mechanisms through integrated scRNA-seq, scTCR/scVDJ-seq, optional protein or chromatin-level assays, and interpretation-focused bioinformatics.
Link CAR-T clonotypes with functional cell states
Profile exhaustion, cytotoxicity, memory, and proliferation
Compare product, blood, marrow, and tumor samples
Generate interpretable multiomics reports for R&D teams
Resolve CAR-T Cell States, Clonal Dynamics, and Immune Context at Single-Cell Resolution
CAR-T research often depends on questions that bulk assays cannot fully answer. A bulk RNA-seq profile can show an average expression trend. A bulk TCR-seq profile can show repertoire-level clone abundance. But neither can directly show which clone belongs to which cell state, which population is driving a signal, or how product heterogeneity changes across samples.
Our CAR-T Single-Cell Multiomics Solution is built for those questions. We help R&D teams connect CAR-T or T-cell clonotype identity with transcriptomic state, surface phenotype, chromatin accessibility, and sample context when the study design supports it.
Why Bulk Assays Can Miss CAR-T Biology
Bulk assays are useful when the main goal is a broad signal. They become limiting when the research question depends on cell-level context.
A single CAR-T product may include cytotoxic-like cells, exhausted cells, proliferating cells, memory-like cells, bystander immune cells, and low-frequency clones that may be important for the project. When these signals are averaged together, it can be hard to know what changed and why.
This matters when your team needs to compare:
Pre-infusion product and post-infusion samples
Different manufacturing conditions
Responding and non-responding research cohorts
Baseline and relapse samples
CAR-T cells and host immune populations
Product composition and tumor microenvironment context
What Single-Cell Multiomics Adds to CAR-T Research
Single-cell multiomics helps put each signal back into context. Instead of looking only at average expression or repertoire-level clone frequency, your team can ask which cells carry the signal, which clones are involved, and how that pattern changes across samples.
Depending on the assay design, we can help examine:
CAR-T or T-cell cell-state composition
Cytotoxicity, exhaustion, memory-like, and proliferation signatures
TCR clonotype distribution and V(D)J gene usage
Clonotype-state relationships
Surface protein marker patterns through CITE-seq
Regulatory programs through scATAC-seq or single-cell multiome
Longitudinal changes across product, blood, marrow, or tumor samples
Tumor microenvironment and immune interaction patterns
For projects focused on expression-state profiling, our Single-cell RNA Sequencing service can serve as the core assay. When clonotype-state linkage is needed, we can integrate single-cell immune repertoire analysis into the study design.
What We Profile Across CAR-T Product, Blood, Bone Marrow, and Tumor Samples
CAR-T research samples are not interchangeable. A product sample asks one kind of question. A peripheral immune sample asks another. Bone marrow and tumor-derived samples add microenvironment complexity. We design the profiling plan around the sample source, timepoint, and biological question.
Pre-Infusion Product Heterogeneity
A CAR-T product can contain functionally different cell populations even when the cells share the same target or construct. Single-cell profiling helps reveal that heterogeneity before the product is compared with later research samples.
T-cell subset composition
Memory-like and effector-like states
Exhaustion-associated signatures
Proliferation-associated states
Cytotoxic gene programs
Expanded clonotypes and their transcriptional states
Product-to-product or batch-to-batch differences
This is useful when your team wants to understand whether a product contains the cell states and clone profiles expected for downstream research.
Post-Infusion Expansion and Persistence
Longitudinal sample comparison can help track how CAR-T or T-cell populations change after infusion in research studies. Single-cell multiomics connects clone abundance with expression state and immune context across timepoints.
Product and post-infusion blood-derived immune cells
Early and later timepoints
Expanded and contracted clones
Persistent and transient cell states
CAR-T-like signatures and host immune populations
The goal is not to make outcome claims. The goal is to give your team a clearer research view of cellular dynamics and clone-state changes.
Bone Marrow, Tumor Biopsy, and Relapse Research Samples
Bone marrow and tumor-derived samples can reveal immune and tumor microenvironment features that product-only profiling cannot show. These samples may be useful when the research question involves persistence, resistance, relapse biology, or immune suppression.
Bone marrow immune microenvironment profiling
Tumor-infiltrating immune cell state mapping
Relapse sample comparison
Antigen-expression context when compatible data are available
Myeloid, stromal, or suppressive immune populations
CAR-T and host immune population relationships
Tumor Microenvironment and Host Immune Response
CAR-T behavior is shaped not only by the product, but also by the host immune context and tissue environment. Single-cell multiomics can help your team examine how immune populations, tumor cells, and suppressive microenvironment signals appear across samples.
Immune cell composition
T-cell exhaustion and activation programs
Myeloid and suppressive cell populations
Cytokine-response signatures
Cell-cell interaction patterns
Tumor and immune compartment relationships
Demo Results: What Your CAR-T Multiomics Report May Include
The final report should help your team read the data quickly, not just store it. The examples below show the types of outputs we can include depending on assay design and data quality.
CAR-T Cell-State Landscape
A cell-state landscape can show major cell populations and CAR-T-related states in a single visualization. This may include cytotoxic-like, exhausted-like, memory-like, proliferative, regulatory-like, or other annotated populations when supported by marker patterns.
Typical outputs may include UMAP or clustering plots, cell-state annotation, marker gene dot plots, cell-state composition charts, and product-to-product or sample-to-sample comparison.
Clonotype-State Integration Map
When scTCR/scVDJ information is included, clonotypes can be mapped onto single-cell expression states. This helps your team evaluate whether expanded clones are associated with specific phenotypes.
Typical outputs may include dominant clonotype distribution, V(D)J gene usage summary, clonotype overlay on UMAP, clonotype-state bubble plots, clone sharing across samples, and expanded clone phenotype summaries.
Longitudinal Persistence and Sample Comparison View
For studies with multiple timepoints or sample sources, we can organize results into longitudinal views. These may compare product, blood, marrow, tumor-derived, or relapse research samples.
Typical outputs may include alluvial plots, stacked abundance plots, sample-comparison heatmaps, cell-state shift summaries, persistent vs transient clone views, and cross-timepoint marker or pathway comparisons.