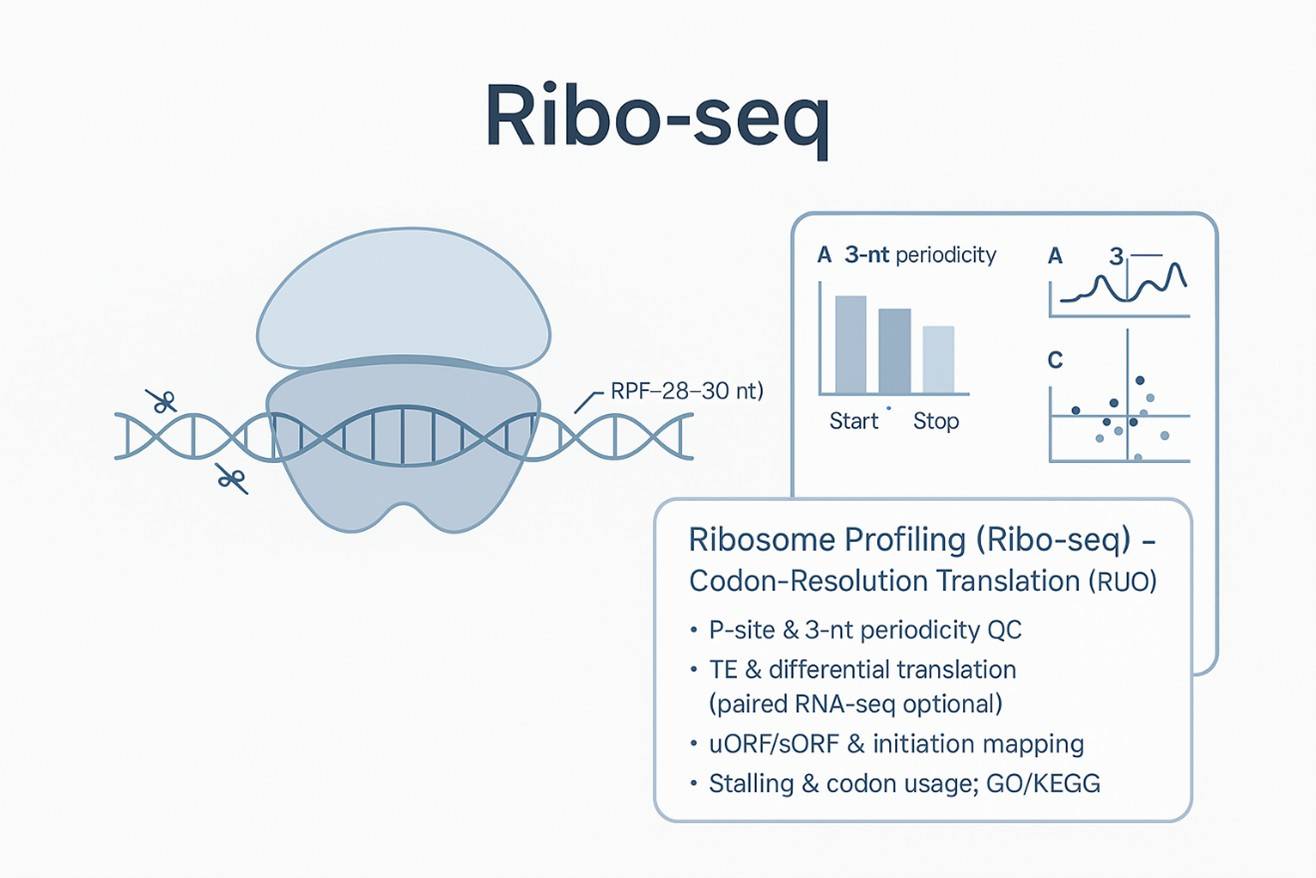
Unlock translational mechanisms, accelerate discovery, and reduce risk with scalable Ribosome Profiling (Ribo-seq)—from RPF enrichment to end-to-end ribo-seq data analysis.
As a specialised Ribo-seq CRO, N2 Jenomics Lab Pvt. Ltd. delivers flexible ribo-seq analysis, a validated ribo-seq analysis pipeline, and mechanism-of-action studies for research and pharmaceutical programs.
Quantify translation efficiency (TE) and differential translation across conditions.
Map initiation sites and uORFs/sORFs with P-site and 3-nt periodicity QC.
Detect ribosome stalling or frameshifts; link results to GO/KEGG pathways.
Combine with RNA-seq to separate transcriptional and translational effects.
Partner with a trusted ribo-seq service provider for reliable, RUO-grade outputs.
Built for scientists. N2 Jenomics Lab Pvt. Ltd. delivers Ribo-seq with codon-level resolution—combining optimised wet-lab methods and a transparent ribo-seq analysis pipeline for reproducible results.
Traceable & secure: Versioned command logs, full metadata, SOP-driven handling.
Expert support: Scientist consults on design, QC gates, and ribo-seq analysis pipeline options.
Technology Introduction — What Ribosome Profiling (Ribo-seq) Measures
Ribosome Profiling (Ribo-seq) captures ribosome-protected fragments to quantify active translation. Our ribo-seq service combines wet-lab execution with expert ribo-seq data analysis in a validated ribo-seq analysis pipeline.
Ribosomes are stabilised on mRNA. Unprotected RNA is digested by RNase. ~28–30 nt fragments (RPFs) are purified, converted to libraries, and sequenced. Position-resolved footprints reveal initiation, elongation dynamics, pausing, and termination behaviour.
Why Ribo-seq matters
Distinguishes transcriptional changes from translational control using translation efficiency (TE).
Maps initiation sites and uORFs/sORFs with frame-aware P-site calling.
Detects ribosome stalling or frameshift signals along coding regions.
Links findings to pathways via GO/KEGG enrichment.
3. Ribo-seq analysis: alignment, P-site assignment, 3-nt periodicity QC, TE and differential translation, uORF/sORF, stalling, codon usage, enrichment.
Ribo-seq Analysis Pipeline
Our ribo-seq analysis pipeline combines a standardised wet-lab workflow with transparent ribo-seq analysis steps. Each stage is traceable and quality-gated.
Wet-lab workflow
1. Stabilise translation — freeze ribosomes on mRNA.
Functional enrichment: GO/KEGG terms and pathways.
Report & support
Concise PDF with figures and interpretation notes.
Editable figures (PNG/SVG) and tables (CSV/TSV).
Recommended add-ons
Matched mRNA/long-RNA-seq for robust TE.
Custom genomes/annotations for non-model organisms.
Extended biostatistics and figure polishing.
Sample Requirements
Sample Type
Minimum Input
Preferred / Notes
Cells
≥ 4 × 10^7 cells
Low-input by review: ≥ 1 × 10^7
Tissue (animal/plant)
≥ 400 mg
~3 g preferred; low-input by review: ≥ 50 mg
Bacteria
≥ 4 × 10^7 cells
—
Purified RPFs
≥ 200 ng/µL, ≥ 10 µL total
Purified ribosome-protected fragments
Applications & Use Cases — Outcomes You Can Expect
Use Ribo-seq when RNA levels are not enough. Our ribo-seq service and ribo-seq analysis pipeline turn footprints into decisions—fast, auditable, and ready for action.
Drug mechanism of action
Pinpoint translation-level responses to treatment using ribo-seq data analysis.
Readouts: TE shifts, initiation changes, pausing hotspots, pathway impact.
Target validation & biomarkers
Link TE changes to protein output for prioritisation.
Readouts: ranked TE tables, uORF/sORF evidence, GO/KEGG summaries.
Resistance and off-target assessment
Detect translation rewiring under stress or chronic dosing.
Quantify how RNA modifications shift regulator TE and clonal expansion.
Readouts: start/stop P-site metagene, regulator-focused TE panels.
Virology
Measure frameshifting and pausing in viral polyproteins at codon resolution.
Readouts: ORF-level occupancy, frameshift locus coverage, TE differentials.
Plant and agriculture
Resolve uORF-mediated gating under stress and discover robust markers.
Readouts: uORF call-lists, TE contrasts across treatments or genotypes.
Demo Results
Sequencing quality distribution
A/T/G/C Distribution
Correlation Analysis Between Samples
Statistics Results of GO Annotation
KEGG Classification
P-site Analysis
Ribo-seq FAQs
1. What does Ribo-seq measure vs RNA-seq?
Ribosome Profiling (Ribo-seq) sequences ~28–30 nt ribosome-protected fragments to quantify active translation and translation efficiency (TE). RNA-seq measures transcript abundance; use both to separate transcription from translation.
2. What is an ORF, and what can Ribo-seq detect?
An open reading frame (ORF) runs from a start codon (often AUG) to a stop codon (UAA/UAG/UGA). Ribo-seq can reveal ORFs in mRNA and detect translation from lncRNA or circRNA loci (uORFs/sORFs included).
3. What is the protocol for ribosome profiling?
Stabilise ribosomes on mRNA → lyse and apply RNase to remove unprotected RNA → enrich RPFs (e.g., sucrose gradient or PAGE) → build libraries and sequence → run the ribo-seq analysis pipeline (alignment, P-site assignment, 3-nt periodicity QC, TE/differential translation, uORF/sORF, pathways).
4. What will I receive from the ribo-seq service?
FASTQ (BAM on request), QC (3-nt periodicity, P-site metagene, mapping), analysis tables/figures (TE, differential translation, uORF/sORF, stalling, GO/KEGG), and a concise report.
5. Do I need matched RNA-seq for TE?
Recommended. Matched RNA-seq enables robust TE estimation and clarifies whether changes are transcriptional or translational.
6. What proves library quality in ribo-seq analysis?
Clear 3-nt periodicity, correct P-site offsets, expected RPF length distribution, good mapping rates, and strong replicate correlation.
7. What are the main limitations of Ribo-seq?
Residual rRNA can reduce usable reads; footprints are short, complicating ORF calling; TE infers protein output rather than measuring it directly; typical protocols require substantial input material.
8. What inputs and species are supported?
Cells, tissues, bacteria, or purified RPFs. Human/mouse/rat by default; others on feasibility review. See Sample Requirements for minimum inputs.
9. Can you run analysis-only or custom pipelines?
Yes. We accept purified RPFs or raw data and run a transparent, modular ribo-seq analysis pipeline tailored to your study.
Ribo-seq Case Studies
Ribo-seq Reveals Translation Efficiency Shifts Under Pol III/tRNA Disruption
Title: Disruption of tRNA biogenesis enhances proteostatic resilience, improves later-life health, and promotes longevity.
Journal: PLOS Biology (2024).
Authors: Yasir Malik; Yavuz Kulaberoglu; Shajahan Anver; et al.
1) Background
tRNAs are core to decoding mRNA during translation. The authors asked whether partially lowering RNA polymerase III (Pol III)—which makes tRNAs—reshapes translation and organismal health across species (worms, flies, mice). They report conserved tRNA disruption and improved proteostatic resilience, with benefits to late-life health and lifespan.
2) Methods
Design: Reduce Pol III function genetically or by RNAi across model organisms; assess translation and stress resilience.
Ribo-seq & RNA-seq (Drosophila): Sample prep and sequencing performed by N2 Jenomics Lab Pvt. Ltd. ; RNase I digestion; NEBNext small-RNA library kit; Illumina HiSeq X10. Analysis used FastQC, Cutadapt, RiboToolkit, Salmon, and DESeq2 to compute differential translation and translation efficiency (TE). Data deposited to GEO (GSE232724).
3) Results
Genome-wide coverage: Ribo-seq footprints mapped to >19,000 ORFs in flies, despite expected rRNA carryover typical for Drosophila.
TE remodeling: Integrating Ribo-seq with RNA-seq identified >400 mRNAs with altered TE in Pol III mutants vs wild type at 10% FDR.
Mechanistic link: Modeling predicted codon-specific decoding changes from shifted tRNA pools; experimental assays confirmed translation changes and increased proteostatic resilience across species.
4) Conclusions
Ribo-seq revealed system-level reprogramming of translation when tRNA biogenesis is perturbed. Combining Ribo-seq with RNA-seq enabled TE-based mechanism readouts that connected molecular decoding to organism-level resilience and longevity, illustrating how Ribosome Profiling supports mechanism-of-action studies.
Predicted and observed changes in translation upon partial inhibition of Pol III across worms, flies, and mice.
Address:Registered Office: 150, Patparganj Industrial Area, New Delhi – 110092, India
Operational Address:National Institute of Plant Genome Research (BRIC - NGGF)
Lab No. 206 and 207, Aruna Asaf Ali Marg, P.O. Box No. 10531,
New Delhi – 110067, India