Metatranscriptomic Sequencing
Home
> Metatranscriptomic Sequencing
Metatranscriptomic Sequencing for Microbiome Functional Profiling
Uncover Real-Time Microbial Activity with High-Resolution RNA-Seq
Profile active gene expression from bacteria, fungi, viruses, and archaea to uncover microbial functions in environmental, agricultural, and microbiome research.
Our RNA-based profiling delivers actionable insights—functional pathways, biomarkers, and publication-ready data—to accelerate your research success.
Metatranscriptomic sequencing provides a real-time snapshot of gene activity within microbial communities. Rather than analysing what genes are present (as in metagenomics), this method focuses on what genes are actively expressed under specific conditions—revealing microbial behaviour, regulation, and metabolic output. Whether you're studying the gut microbiome or an industrial fermentation system, metatranscriptomics answers the question:
“What are the microbes doing right now?”
How it works:
Extract total RNA from the sample (e.g. stool, soil, tissue)
Remove ribosomal RNA (rRNA) to enrich for messenger RNA (mRNA)
Convert mRNA into complementary DNA (cDNA)
Construct sequencing libraries and perform high-throughput sequencing
Analyse gene expression patterns to reveal active microbial functions
Metatranscriptomic Sequencing Workflow.
Why Choose Metatranscriptomic Sequencing
This next-generation technique offers deep functional insights that DNA-based methods cannot provide. Instead of simply identifying who’s there, it reveals what they’re doing.
Direct Insight into Microbial Function Quantifies gene expression across all microbial domains—bacteria, archaea, fungi, and viruses.
Culture-Free, Comprehensive Detection By bypassing the need for culturing, the method captures real-world community dynamics across all microbes, including non-culturable species.
Dynamic, Time-Resolved Analysis Compare gene expression across time points or treatment conditions to pinpoint functional changes or identify potential biomarkers.
Supports Mechanistic Discovery Combined with pathway databases like KEGG, it helps reconstruct metabolic routes and regulatory networks.
Compatible with Multi-Omics Integrates seamlessly with metagenomics, host transcriptomics, and metabolomics for deeper biological interpretation.
How Does It Compare to Other Microbiome Tools?
Technique
What It Detects
Reflects Functional Activity?
Resolution
Best For
16S/ITS Amplicon
Marker genes from bacteria/fungi
❌ No
Medium (Genus/Species)
Rapid screening, taxonomic profiling
Metagenomics
All microbial DNA (taxonomy + potential functions)
❌ No (functional potential only)
High (Strain-level)
Identifying species and potential metabolic capabilities
Optional: Higher depth for low-abundance transcripts
Data Quality Metrics:
>80% bases at Q30+
Error rate <0.1%
Accurate, reliable results
Metatranscriptomic Bioinformatics Analysis
Complete data analysis from raw reads to publication-ready visuals, supporting your research and grant needs.
Microbial Expression Profiling
Profile active gene expression across bacteria, fungi, viruses, and archaea
Visualize species abundance and diversity metrics
Functional Annotation & Pathway Analysis
Annotate key genes using UniRef and UniProt
Reconstruct metabolic pathways with KEGG and MetaCyc
Perform differential pathway expression analysis
Antibiotic Resistance & Virulence Detection
Detect antibiotic resistance genes (AMR) and virulence factors
Quantify expression and analyze pathway enrichment
Publication-Ready Visuals & Reports
High-quality PCA, heatmaps, volcano plots, and more
Statistical analysis including LEfSe for key functional differences
Expression data normalized and provided in easy-to-use tables
Sample Requirements for Metatranscriptomic Sequencing
To ensure optimal sequencing performance, samples must meet baseline quantity and purity standards. Custom consultation is available for specialised sample types.
Sample Type
Minimum Requirements
Total RNA
≥ 4 μg (≥ 3 μg minimum), ≥ 50 ng/μL
Cultured Cells
≥ 5 × 10⁶ cells
Environmental Samples
≥ 1.5 grams
📩 Not sure if your sample is suitable? Contact us for personalised pre-treatment guidance.
Is Metatranscriptomics Right for My Research
Metatranscriptomic sequencing reveals what your microbiome is actually doing, not just who’s there. If your study involves microbial activity, gene expression dynamics, or functional pathway shifts, this technique may be a perfect fit.
Ideal Use Cases:
Health & Disease Microbiome Studies Track how gut, skin, or respiratory microbiomes behave under healthy or diseased states.
Drug, Diet, or Environmental Interventions Quantify how treatments impact microbial gene expression and metabolic pathways.
Environmental & Agricultural Microbial Ecology Assess the active functions of microbes in soil, water, or host-associated systems.
Probiotic & Microbiome Therapeutics Development Identify beneficial strains and validate their functional mechanisms in action.
Unculturable Microbe Discovery Detect active expression from hard-to-culture organisms missed by traditional methods.
Common Research Questions We Help Answer:
How does microbial gene activity shift in response to a treatment or condition?
Which genes or pathways are activated after a dietary or pharmaceutical intervention?
Can I uncover new functions in microbes that can’t be cultured in the lab?
How can I functionally characterise strains for probiotic or biomarker development?
Combine Metatranscriptomics with Other Omics for Deeper Insights
Paired Technique
Combined Advantage
Example Application
Metagenomics+ Metatranscriptomics
Identify both potential and actual gene activity
Differentiate silent vs. active strains in microbial communities
Host Transcriptomics + Metatranscriptomics
Decode host–microbe interaction networks
Investigate inflammation/infection models
Metabolomics + Metatranscriptomics
Link gene expression to real metabolic output
Explore drug/diet impact on microbial metabolism
16S/ITS + Metatranscriptomics
Screen large cohorts, then zoom into active samples
Efficient sample triage before deep functional profiling
Why Choose N2 Jenomics Lab Pvt. Ltd. for Metatranscriptomic Sequencing?
When it comes to capturing microbial gene expression with precision and depth, N2 Jenomics Lab Pvt. Ltd. offers more than just sequencing—we deliver actionable insights backed by years of experience and full-service support.
Extensive Multi-Omics Expertise Trusted by top-tier research institutes and biotech companies, we bring a solid track record in transcriptomics, genomics, and microbiome profiling.
Flexible Platform Options Choose from Illumina, MGI, or PacBio platforms to match your sample type, budget, and resolution needs.
Customised Bioinformatics Analysis Gain deeper insights through advanced analytics including functional annotation, pathway enrichment, and differential expression mapping.
Stringent Quality Control at Every Step From sample handling to final reporting, our end-to-end traceability system ensures reliable, reproducible results.
Expert Support From Start to Finish Our technical team offers real-time guidance and troubleshooting, helping you accelerate timelines and overcome project challenges.
Demo Results
Partial results are shown below:
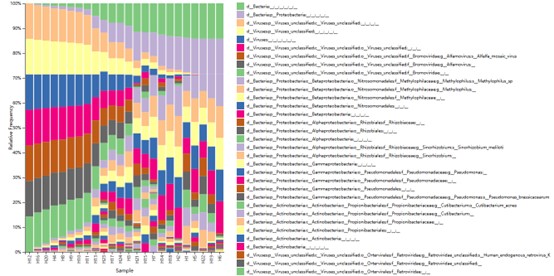
The taxonomy distribution of all sample in Phylum classification level.
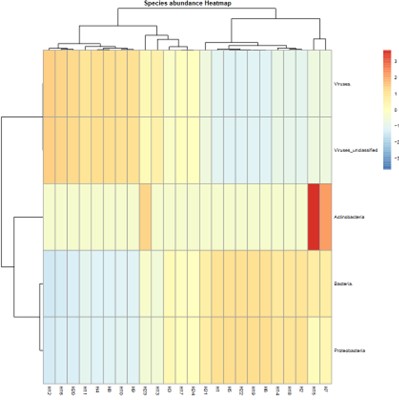
Species abundance Heatmap.
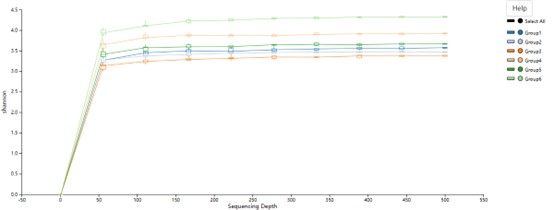
Rarefaction curve of the sequenced reads for all samples.
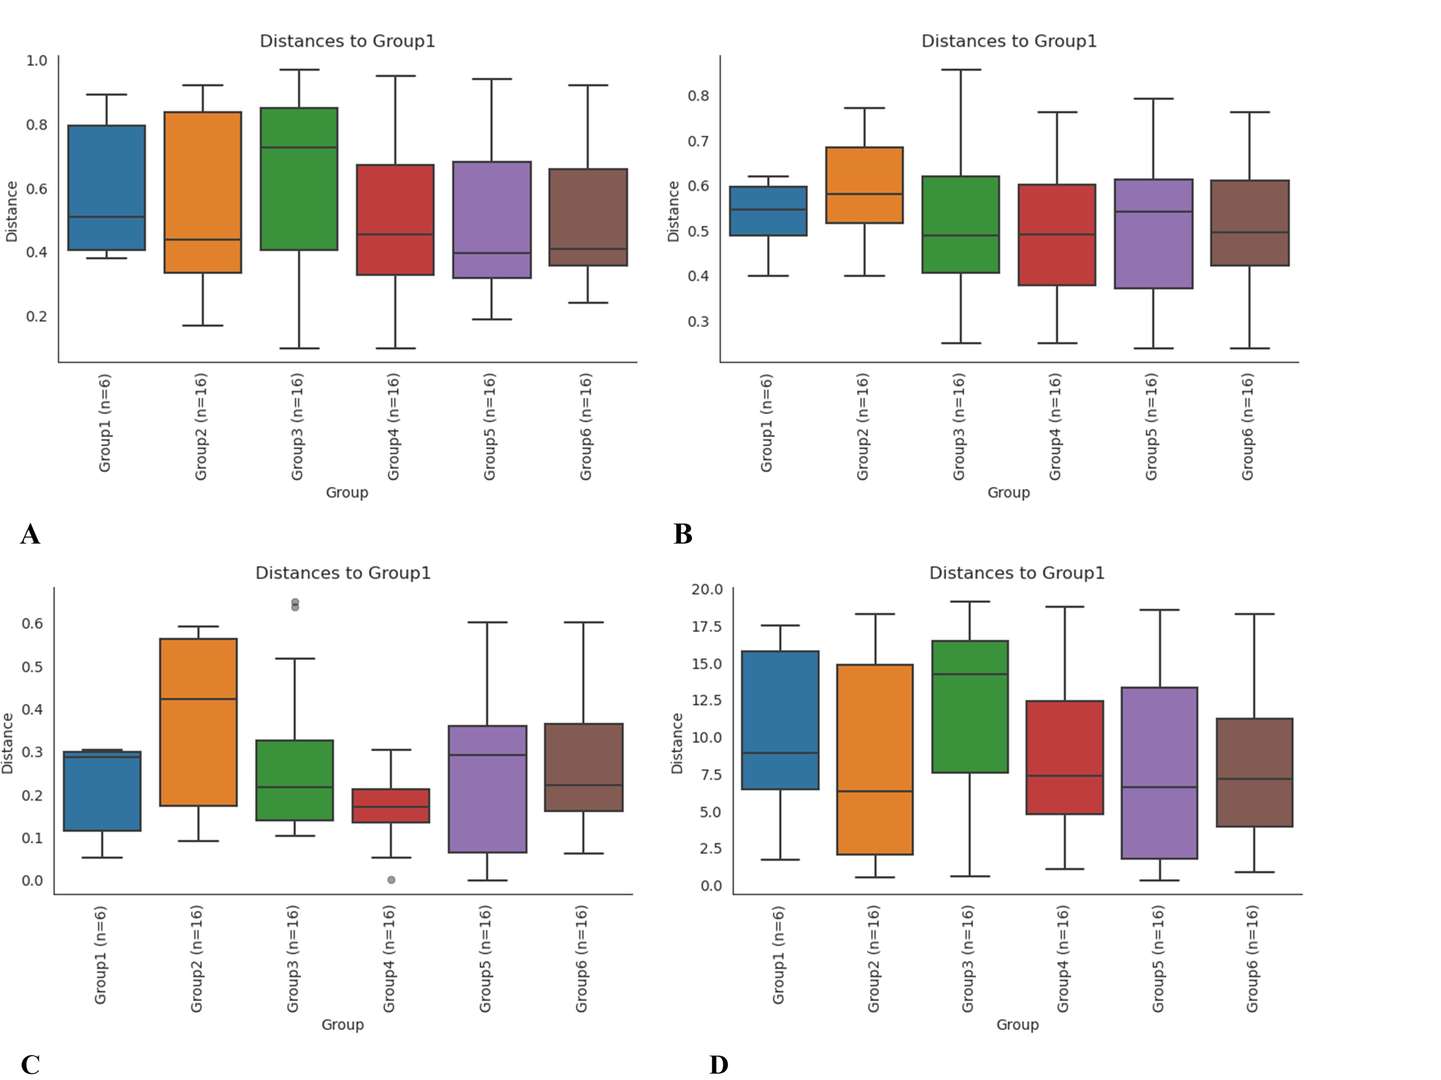
Boxplot analysis based on bray Curtis (A), binary jaccard (B), unweighted unifrac (C), and weighted unifrac (D).
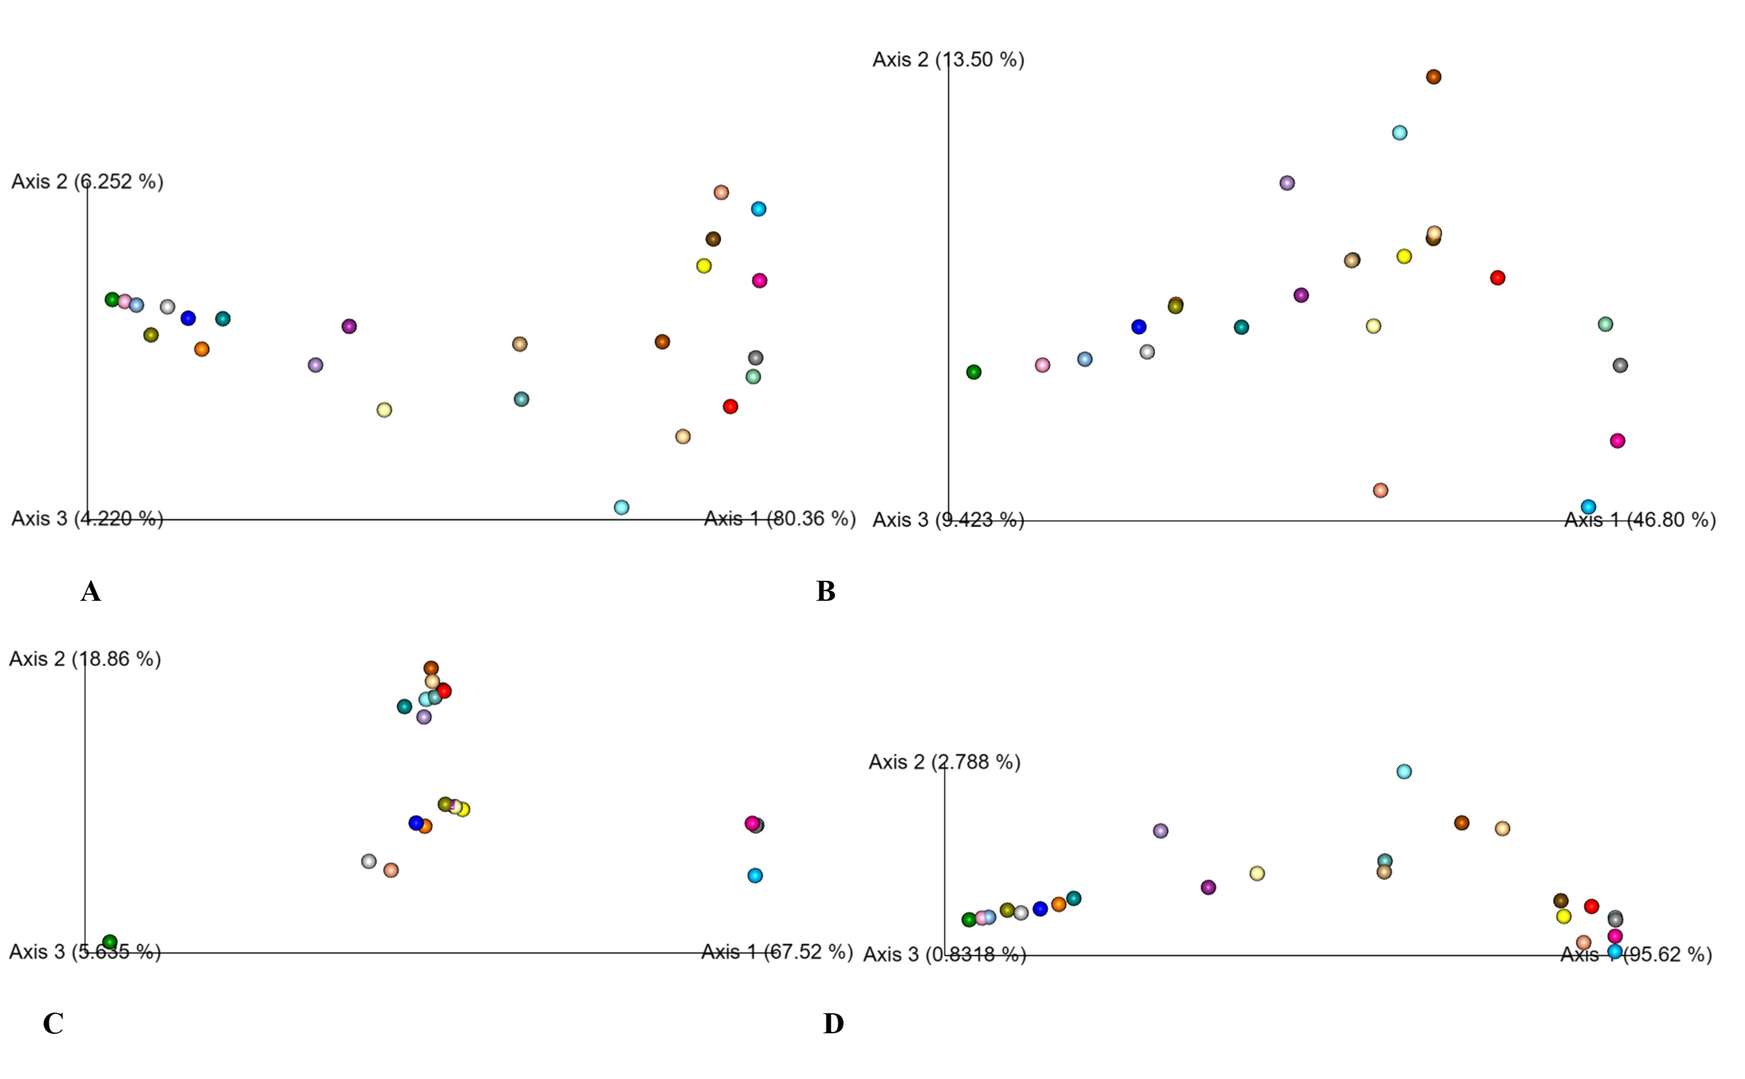
PCoA analysis based on bray Curtis (A), binary jaccard (B), unweighted unifrac (C), and weighted unifrac (D)
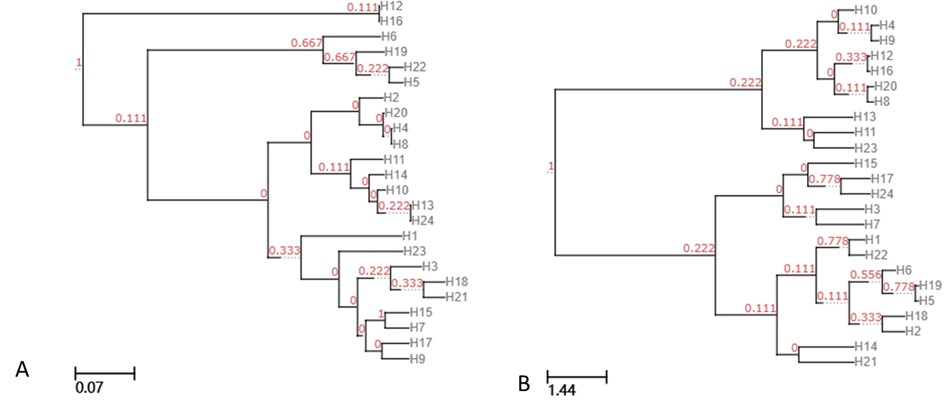
UPGMA clustering tree based on unweighted unifrac (A), and weighted unifrac (B).
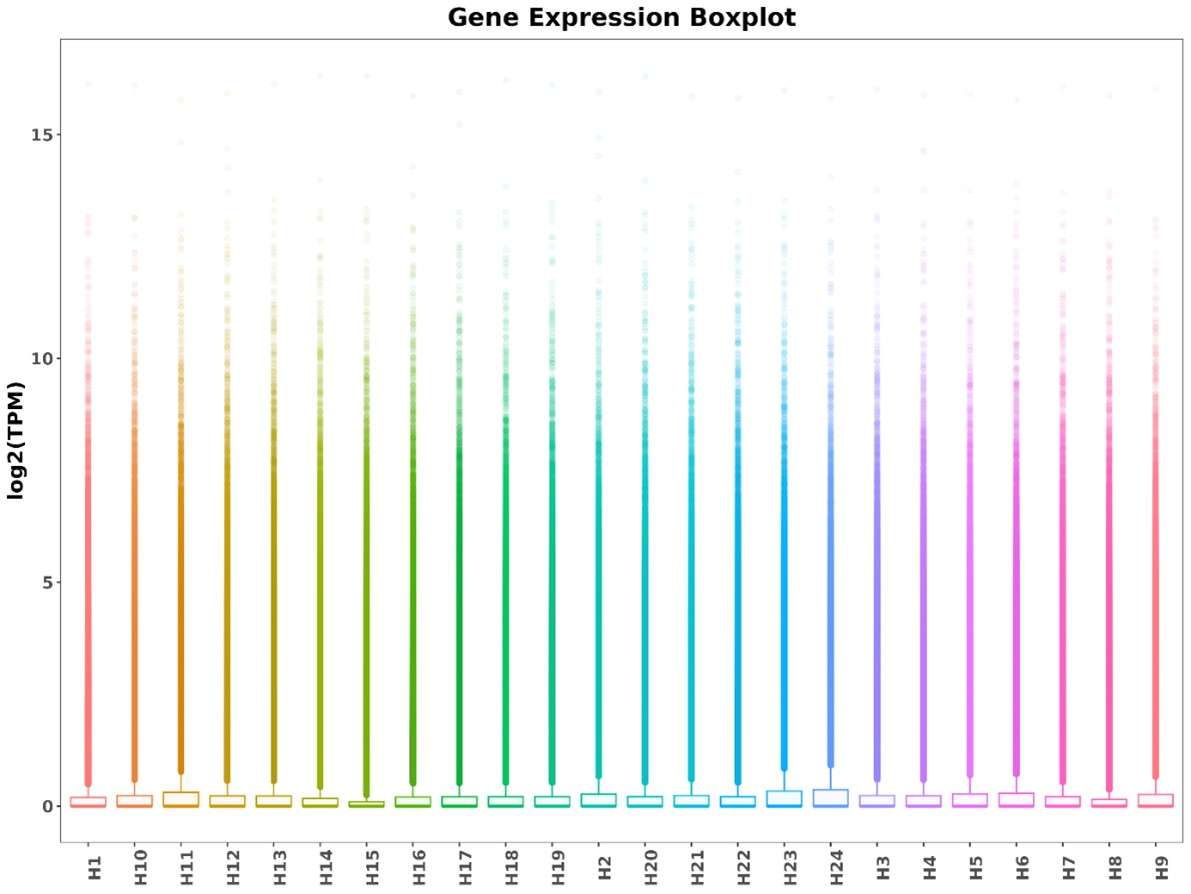
Boxplot of TPM for each sample.
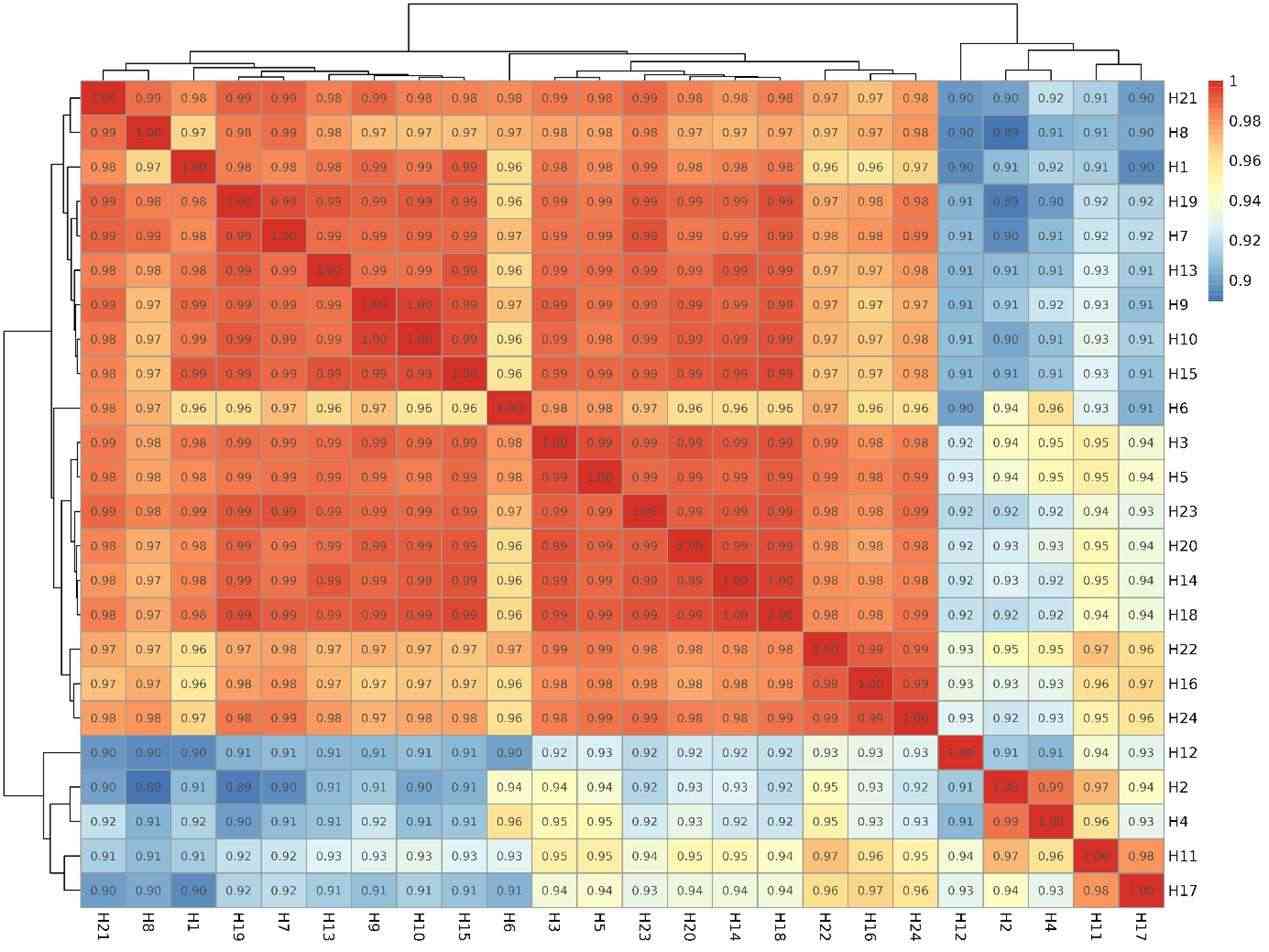
Correlation graph of gene number.
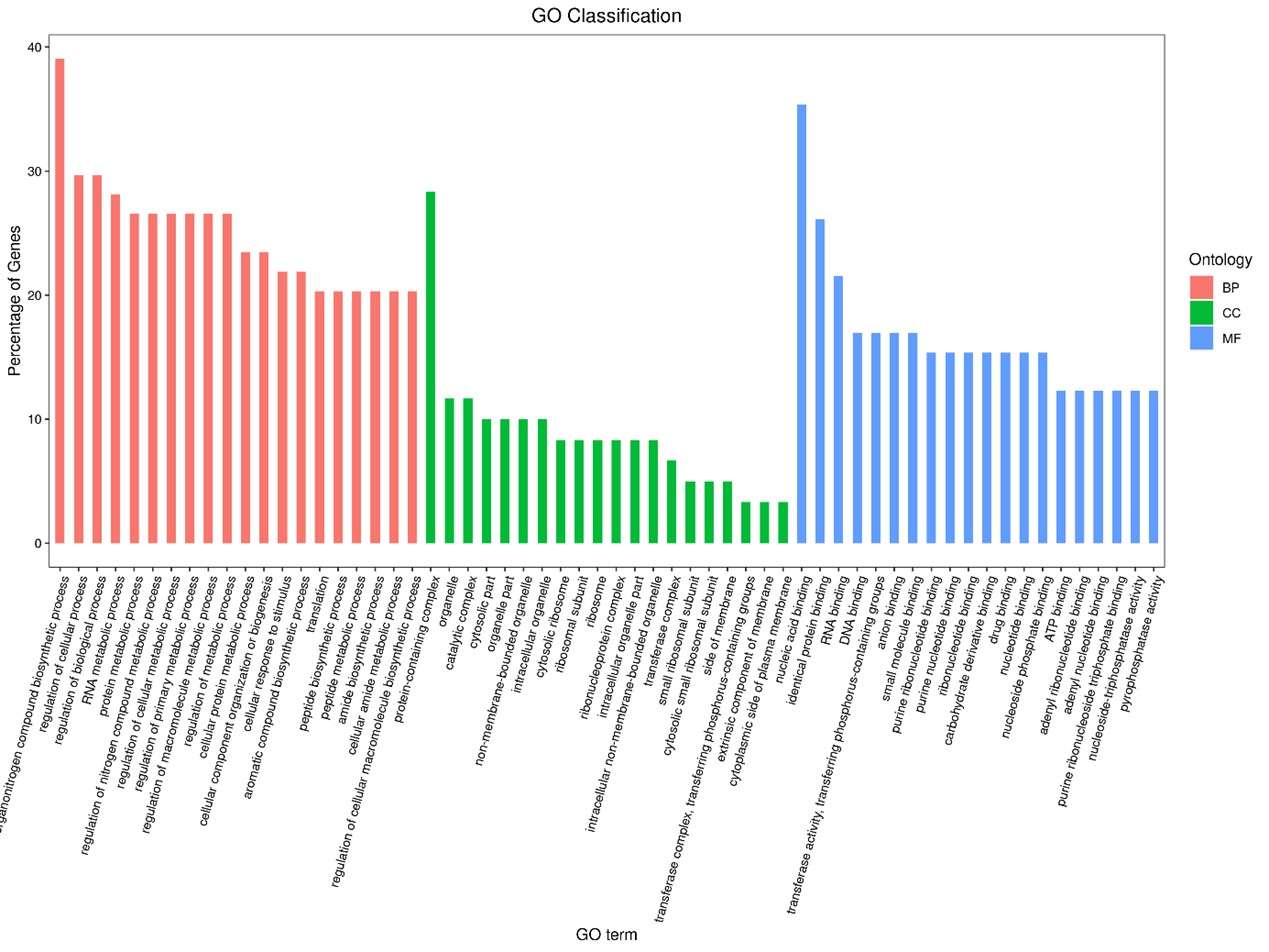
Statistics results of GO annotation for CLC_vs_SLC.
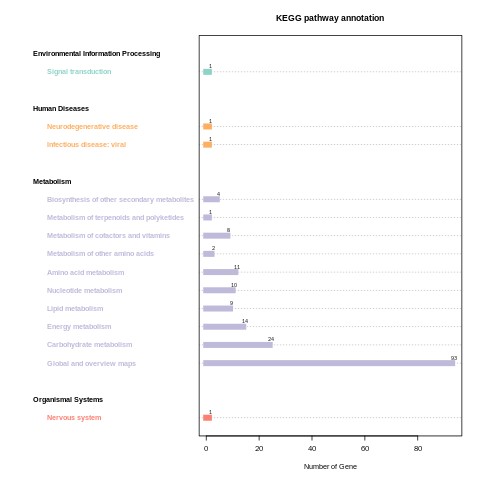
CLC_vs_SLC KEGG_classification.
Statistical of specific function database common and unique annotation.
CAZy function classification.
Metatranscriptomic Seq FAQs
1. What are the noteworthy issues of RNA samples?
The contamination should be rigorously excluded when sampling. In detail, sampling-related instruments and consumables should be sterilized and RNase-free. The freshly obtained samples should be immediately frozen by putting into liquid nitrogen, or directly submitting original environmental or clinical samples to us. The recommended total RNA amount for submission is 6 µg or more with a concentration of greater than 50 ng/µl.
2. What kind of QC methods do you adopt for the customer's samples?
We will perform QC on your total RNA samples prior to sequencing them. We use the Agilent Bioanalyzer to determine the RNA Integrity Number (RIN). If the RIN is lower than 8, the samples will not pass QC. The library QC will also be performed using the Agilent Bioanalyzer to determine library size and purity. Also, prior to loading the libraries on the sequencer, we perform qPCR quantification. The cost for this is included in the sequencing service. The raw data will pass our Q30 filter, which means more than 80% of bases with a greater than Q30 quality score.
3. What are the advantages of metatranscriptomics?
Metatranscriptomics is the genomic analysis of complete microbial transcriptomes, providing a particularly rich source of data on the global diversity of RNA viruses and their evolutionary history. Metatranscriptomics has several advantages over traditional methods such as cell culture, consensus PCR, and metagenomics approaches based on viral particle purification.
Metatranscriptomics has proven successful in characterizing the RNA viromes of diverse invertebrates. Specifically: (i) it uncovers the entire RNA virome, with sufficient coverage to assembly complete viral genomes, including those from co-infecting parasites; (ii) it offers a reliable quantification and assessment of both viral and host RNAs; (iii) it is comparatively simple, requiring minimal sample processing; and (iv) it provides more information than the genome sequence alone, allowing a characterization of viral diversity and ecology.
4. I’m unsure if my samples are suitable for metatranscriptomics. Can you assess them first?
Absolutely. We offer free feasibility assessments based on your study objectives and sample type. Before sequencing begins, we’ll recommend the best platform, depth, and analytical strategy tailored to your goals.
5. Can I integrate metatranscriptomics with metagenomics or other omics datasets?
Yes, we specialise in multi-omics integration. Whether you're combining with metagenomics, metabolomics, or host transcriptomics, our team can build a unified analytical workflow to uncover functional and taxonomic insights across datasets.
References
Shi M, Neville P, Nicholson J, et al. High-Resolution Metatranscriptomics Reveals the Ecological Dynamics of Mosquito-Associated RNA Viruses in Western Australia. Journal of Virology, 2017, 91(17): e00680-17.
Shi M, Zhang Y Z, Holmes E C. Meta-transcriptomics and The Evolutionary Biology of RNA Viruses. Virus research, https://doi.org/10.1016/j.virusres.2017.10.01
Metatranscriptomic Seq Case Studies
Hydrogen-Oxidizing Bacteria Are Abundant in Desert Soils and Strongly Stimulated by Hydration
Journal: mSystems
Published: 2020
DOI: 10.1128/mSystems.01131-20
Background
Desert soils sustain diverse bacterial communities despite extreme aridity. While photosynthesis was traditionally considered the primary energy source, recent evidence suggests atmospheric trace gases (e.g., H₂) may support microbial survival. This study investigated the role of hydrogen-oxidizing bacteria across four global deserts (Australian, Namib, Gobi, Mojave), revealing unprecedented H₂ oxidation rates stimulated by hydration and its coexistence with photosynthesis.
Project Objectives
Metabolic Profiling: Quantify distribution/activity of hydrogenases and photosystems.
Hydration Response: Assess microbial activity shifts during wet-dry cycles.
Cross-Desert Validation: Compare H₂ oxidation in polar vs. nonpolar deserts.
N2 Jenomics Lab Pvt. Ltd. ’ Services
As a genomic analytics partner, N2 Jenomics Lab Pvt. Ltd. enabled:
Photosynthesis and dark carbon fixation rose 3-fold and 1.7-fold, respectively.
Global Desert Conservation
Hydrogenase genes confirmed in all four deserts. H₂ oxidation was simultaneously activated with photosynthesis upon wetting, debunking prior "alternating energy mode" hypotheses.
Figures Referenced
FIG 3 H2 oxidation by Australian desert soil microcosm samples.
Fig. 2: Heatmaps showing hydrogenases (groups 1h/1l/2a) as most abundant respiratory genes. Expression persisted even after hydration (144 TPM in dry soils; stable in wet soils).
Implications
Ecological Modeling: H₂ oxidation is a major energy source for desert microbiomes, revising carbon/energy flux models in arid ecosystems.
Climate Resilience: Hydration-responsive bacteria could engineer drought-tolerant soil communities for desert restoration.
Biogeochemical Impact: Global H₂ consumption by deserts may influence atmospheric gas budgets.
Address:Registered Office: 150, Patparganj Industrial Area, New Delhi – 110092, India
Operational Address:National Institute of Plant Genome Research (BRIC - NGGF)
Lab No. 206 and 207, Aruna Asaf Ali Marg, P.O. Box No. 10531,
New Delhi – 110067, India