N2 Jenomics Lab Pvt. Ltd. provides Single-Cell ATAC-seq Service for researchers who need to study chromatin accessibility at cell-type resolution. We help you evaluate cell or nuclei input, build sequencing-ready chromatin accessibility libraries, and turn sparse single-cell epigenomic data into clusters, peaks, motifs, gene activity outputs, and regulatory interpretation.
Profile open chromatin at single-cell resolution
Compare regulatory landscapes across cell populations
Identify accessible peaks, motifs, and gene activity patterns
Map Cell-Type-Specific Chromatin Accessibility with scATAC-seq
Single-cell ATAC-seq, also known as scATAC-seq, profiles chromatin accessibility across individual cells or nuclei. Instead of averaging signals across a mixed sample, it helps separate regulatory patterns by cell type, cell state, treatment group, or differentiation stage.
This matters when bulk ATAC-seq is too averaged to explain a heterogeneous sample. In tumors, immune tissues, organoids, developmental systems, or disease models, different cell populations may carry different accessible enhancers, promoters, and transcription factor motifs. scATAC-seq helps reveal those differences at single-cell resolution.
We use this service to help research teams move from "which genes are expressed?" to "which regulatory regions may be active in specific cell populations?" The result is not only a sequencing dataset, but a regulatory view that can support mechanism-focused research.
What scATAC-seq Reveals
scATAC-seq identifies regions of open chromatin where transposase-accessible DNA can be captured and sequenced. These regions often include promoters, enhancers, and other regulatory elements that help define cell identity or cell-state transitions.
Cell-type-specific chromatin accessibility
Cluster-specific accessible peaks
Regulatory elements linked to biological groups
Transcription factor motif enrichment
Gene activity scores inferred from accessibility
Differential accessibility across conditions
Connections between chromatin state and gene expression
These outputs are especially useful when your project needs regulatory evidence beyond transcript abundance.
When Chromatin Accessibility Adds Value Beyond scRNA-seq
scRNA-seq is powerful for gene expression and cell identity analysis, but it does not directly measure whether regulatory DNA is accessible. scATAC-seq fills that gap by showing where chromatin is open in different cell populations.
scRNA-seq has identified clusters, but the regulatory drivers remain unclear.
You want to compare enhancer or promoter accessibility between groups.
You need transcription factor motif evidence for candidate regulatory programs.
You want to connect chromatin accessibility with expression through optional integration.
You are studying differentiation, immune activation, tumor evolution, or drug response.
For expression-focused projects, you can review our Single-cell RNA Sequencing service. For broader single-cell project planning, see our Single-Cell Sequencing platform.
Research Areas Supported by scATAC-seq
Research Area
How scATAC-seq Helps
Oncology
Resolves tumor, stromal, and immune regulatory programs at cell-type level.
Immunology
Profiles chromatin accessibility during immune activation, differentiation, or inflammation.
Stem cell research
Tracks regulatory changes during lineage commitment and cell fate transition.
Developmental biology
Helps identify accessible regulatory elements across developmental stages.
Organoid models
Compares differentiation states and regulatory heterogeneity in model systems.
Neuroscience
Supports cell-type-specific regulatory studies in complex neural tissues.
Drug response research
Identifies regulatory shifts associated with treatment or perturbation.
From Cells or Nuclei to Single-Cell Chromatin Libraries
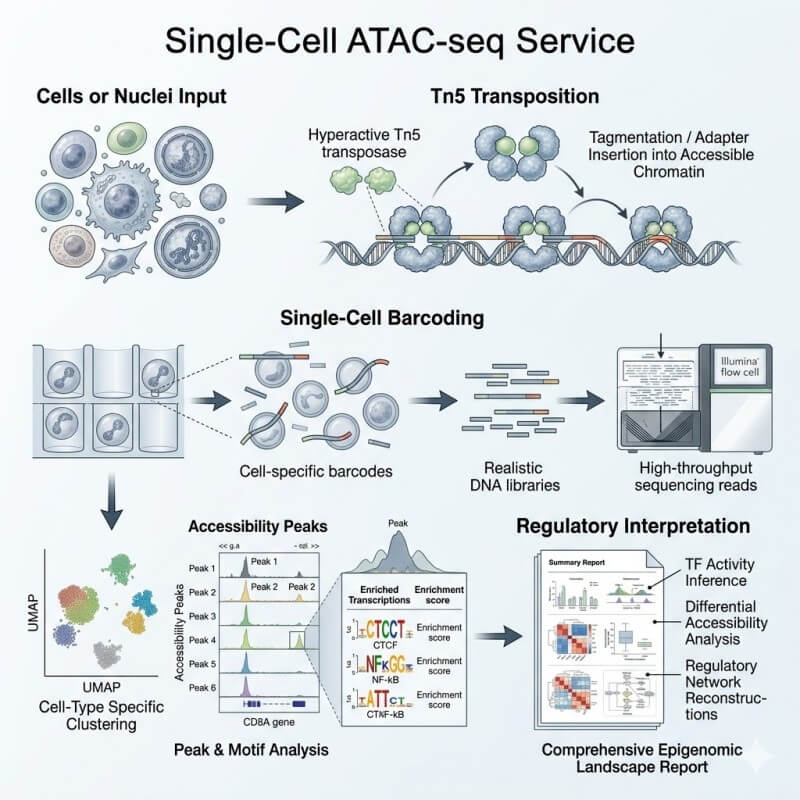
Our scATAC-seq workflow follows your sample from project intake to regulatory interpretation. We review sample quality, transposition behavior, library performance, sequencing output, and data QC before treating the results as biological evidence.
A typical project includes sample feasibility review, cell or nuclei input assessment, Tn5 transposition, single-cell barcoding, library construction, sequencing, data QC, and bioinformatics analysis.
Project Intake and Sample Feasibility Review
We begin with your sample and the regulatory question you want to answer. Our team reviews sample type, species, tissue source, preservation method, expected cell or nuclei input, biological groups, and downstream analysis goals.
Is the input a cell suspension, nuclei suspension, tissue, blood sample, or sorted subset?
Is the sample fresh, frozen, cryopreserved, or already processed?
Is the sample expected to contain debris, clumps, dead cells, or fragile nuclei?
Are the biological groups balanced across conditions?
Will the analysis require only standard scATAC-seq outputs, or also motif and integration analysis?
Does the project need comparison with scRNA-seq, snRNA-seq, or public datasets?
This review helps us decide whether scATAC-seq is a suitable workflow and which preparation details should be addressed before sample submission.
Nuclei Preparation or Input Assessment
scATAC-seq commonly uses nuclei as input because chromatin accessibility is measured through transposase access to nuclear DNA. If you already have cells or nuclei prepared, we review input quality before library preparation. If your project starts from tissue, we first consider whether nuclei can be recovered in a condition suitable for transposition.
Cell or nuclei concentration
Nuclei integrity
Debris level
Clumping or aggregation
Over-fragmented or ruptured nuclei
Sample handling history
Potential inhibitors or contaminants
Suitability for downstream transposition
Poor input quality can reduce useful fragments, weaken TSS enrichment, increase background signal, and make clustering or annotation more difficult.
Tn5 Transposition and Single-Cell Barcoding
In scATAC-seq, accessible chromatin regions are tagged by Tn5 transposase. These accessible DNA fragments are then linked to single-cell or single-nucleus barcodes, allowing reads to be assigned back to individual cells or nuclei.
Prepare or assess cells or nuclei.
Use transposase to tag accessible chromatin regions.
Partition individual nuclei or cells for barcoding.
Construct sequencing libraries from barcoded fragments.
Sequence open-chromatin fragments.
Assign fragments back to cell barcodes.
Build accessibility profiles for downstream analysis.
This workflow allows chromatin accessibility to be studied at the single-cell level rather than as an average signal across the whole sample.
Library QC, Sequencing, and Data QC
After barcoding and library construction, we review library performance and sequencing data quality before moving into biological interpretation.
Library yield and fragment profile
Read quality
Barcode recovery
Unique fragments per cell
Fragment size distribution
TSS enrichment
FRiP or peak-related QC metrics when applicable
Cell calling results
Doublet or low-quality cell review
Peak quality and background signal
These QC layers help determine whether the dataset is suitable for clustering, peak calling, motif analysis, and condition comparison.
From QC Review to Regulatory Interpretation
Once the data pass QC review, we move into regulatory analysis. This includes alignment or fragment processing, peak calling, construction of a cell-by-peak accessibility matrix, clustering, dimensionality reduction, marker peak identification, annotation support, motif enrichment, and optional integration.
The goal is to provide outputs that your team can inspect, question, reuse, and connect to the next experiment.
Sample Requirements for scATAC-seq Projects
Sample preparation is one of the most important factors in scATAC-seq data quality. The values below are practical references for planning. Final requirements may vary by species, tissue type, sample condition, platform choice, and project design.
Sample Type
Recommended Input
Quality Requirements
Shipping / Storage
Key QC Checkpoints
Notes
Cell suspension
>1×10⁵ cells as a reference
>80% viability; 500–1,000 cells/µL; <5% aggregation; no fragments >40 µm
Cold-chain or project-dependent handling
Viability, debris, aggregation, inhibitors
Suitable for high-quality dissociated cells.
Nuclei suspension
Project-dependent; review before submission
Intact nuclei, low debris, low clumping
Cold-chain as advised
Nuclei integrity, concentration, singlets
Preferred input for many scATAC-seq workflows.
Blood or immune cell samples
>5 mL whole blood in EDTA tube as a reference
No heparin anticoagulant
Fresh shipment as advised
Cell recovery and immune subset preservation
Useful for PBMC or immune-cell projects.
Fresh tissue
0.3 cm × 0.3 cm, 4–5 pieces as a reference
Avoid large tissue blocks
Cold-chain coordination
Tissue integrity and nuclei release
Requires feasibility review before project setup.
Frozen tissue
Project-dependent
Avoid repeated freeze-thaw
Dry ice or frozen condition
Nuclei release, debris, chromatin integrity
Requires review before project setup.
Sorted subsets
Project-dependent
Low debris and sufficient cells or nuclei
As advised
Recovery, concentration, viability or nuclei integrity
Useful for rare populations or targeted cell subsets.
For broader submission guidance, please review our Sample Submission Guidelines.
Bioinformatics for Chromatin Accessibility and Regulatory Interpretation
A scATAC-seq project should not stop at read alignment or peak calling. You need to know whether the data can support clustering, which cell populations carry specific accessibility patterns, and which regulatory elements or motifs may explain biological differences.
N2 Jenomics Lab Pvt. Ltd. connects QC metrics, accessibility peaks, cell clustering, motif enrichment, gene activity, and optional transcriptomic integration in one analysis workflow.
Minimum Analysis Deliverables
Deliverable
What You Receive
Why It Matters
Raw sequencing data
FASTQ files
Enables data archiving and future reprocessing.
Alignment output
BAM or aligned fragments when applicable
Supports review of mapped chromatin fragments.
Fragment file
Barcode-linked chromatin fragments
Core input for downstream scATAC-seq analysis.
Cell calling summary
Retained cell or nuclei barcode summary
Helps evaluate usable cell recovery.
Cell-by-peak matrix
Accessibility matrix across cells and peaks
Forms the basis for clustering and comparison.
Peak set and peak annotation
Accessible regions with genomic annotation
Supports regulatory element interpretation.
QC summary
Library, sequencing, and cell-level QC metrics
Helps judge whether the dataset supports analysis.
Fragment size distribution
Nucleosome-related fragment pattern review
Supports library quality assessment.
TSS enrichment summary
Enrichment near transcription start sites
Common signal-quality indicator for ATAC data.
Dimensionality reduction plots
UMAP or t-SNE views
Shows cell-level accessibility structure.
Clustering results
Cluster assignments and metadata
Supports cell population discovery.
Marker peak table
Cluster-associated accessible regions
Helps define regulatory differences by group.
Cell type annotation support
Annotation based on accessibility and optional references
Connects clusters to biological meaning.
Analysis report
Methods, figures, tables, and notes
Gives your team a readable project summary.
Optional Advanced Regulatory Analysis
Motif enrichment analysis
Transcription factor activity inference
Gene activity score calculation
Peak-to-gene linkage
Differential accessibility analysis by cluster or condition
Comparison between treatment, genotype, disease, or time-point groups
Trajectory or differentiation-state analysis
Regulatory network interpretation
Public dataset comparison
Custom analysis for non-model organisms
Integration with scRNA-seq, snRNA-seq, or other omics data
Integration with scRNA-seq and Other Omics Data
Many researchers use scATAC-seq after scRNA-seq has identified important cell populations. In that setting, scATAC-seq helps explain the regulatory layer behind gene expression changes.
Label transfer from scRNA-seq to scATAC-seq clusters
Joint embedding of RNA and ATAC datasets
Gene activity and expression comparison
Linking accessible peaks to nearby genes
Prioritizing transcription factors for follow-up
Comparing regulatory states across conditions
When expression and accessibility need to be measured in the same cell, a single-cell multiome strategy may be more appropriate. When the chromatin accessibility layer is the main question, standalone scATAC-seq can be a focused and efficient option.
Reusable Files and Parameter Transparency
We do not treat single-cell epigenomics analysis as a black box. When applicable, we can provide reusable files and analysis notes so your internal bioinformatics team can review the workflow.
FASTQ files
BAM or fragment files
fragments.tsv.gz
peaks.bed
cell-by-peak matrix
metadata table
cluster annotation table
motif enrichment table
gene activity matrix
differential accessibility table
figure files
analysis report
Seurat, ArchR, or Signac-compatible objects when applicable
Pipeline notes and parameter summaries
Choosing scATAC-seq Against Related Epigenomic Options
The right epigenomic or transcriptomic method depends on your biological question. We help you choose the option that fits your sample, required resolution, and interpretation goals.
Method
Molecular Layer
Best-Fit Sample
Resolution
Strength
Limitation
When to Choose
scATAC-seq
Chromatin accessibility
Cells or nuclei
Single-cell
Resolves cell-type-specific regulatory elements
Sparse data; needs careful analysis
Choose this when cell-type-specific chromatin accessibility is the key question.
Bulk ATAC-seq
Chromatin accessibility
Tissue or cell population
Bulk sample average
Simpler workflow and lower analysis complexity
Masks cell-type-specific signals
Choose this when sample-average accessibility is sufficient.
scRNA-seq
Gene expression
Viable cells or nuclei depending on workflow
Single-cell or single-nucleus
Defines cell identity and expression states
Does not directly measure chromatin accessibility
Choose this when gene expression and cell-state mapping are the main focus.
Single-cell multiome
ATAC + gene expression
High-quality cells or nuclei
Same-cell multi-layer
Links accessibility and expression directly
Higher complexity and stricter sample needs
Choose this when same-cell accessibility and expression are both required.
CUT&Tag / ChIP-seq
Protein-DNA binding or histone mark enrichment
Cells or tissue, depending on method
Bulk or low-input depending on workflow
Target-specific TF or histone mark profiling
Requires target-specific antibody
Choose this when a specific chromatin protein, TF, or histone mark is the focus.
Practical Selection Rules
Choose scATAC-seq when your main question is cell-type-specific chromatin accessibility.
Choose bulk ATAC-seq when you need a sample-average accessibility screen and do not need to separate signals by cell population.
Choose scRNA-seq when cell identity, gene expression, and transcriptomic states are the primary focus.
Choose single-cell multiome when accessibility and expression must be measured in the same cell.
Choose CUT&Tag or ChIP-seq when your study focuses on a specific transcription factor, histone mark, or chromatin-associated protein.
Combine methods when regulatory interpretation requires more than one evidence layer. For immune-focused projects, you may also explore our scTCR/BCR-seq Service. For nuclei-based transcriptomic profiling, see our snRNA-seq Service.
Why Work With N2 Jenomics Lab Pvt. Ltd. for scATAC-seq
A successful scATAC-seq project requires more than library construction and sequencing. It needs sample judgment, chromatin-accessibility-specific QC, careful data processing, and regulatory analysis that your team can understand and reuse.
Sample-First Project Review: We begin with your sample and research goal. Before project setup, our team reviews input type, sample condition, biological groups, expected cell or nuclei quality, and downstream analysis needs.
QC-Aware Single-Cell Epigenomics Workflow: We review quality across sample or nuclei input, transposition suitability, library QC, sequencing data QC, barcode recovery, fragment quality, TSS enrichment, peak quality, and clustering behavior.
Custom Regulatory Bioinformatics: We can adapt the analysis plan around your research question, including condition comparison, motif analysis, gene activity scoring, integration with scRNA-seq, and custom reporting for selected cell populations.
Deliverables Your Team Can Review and Reuse: You receive outputs that support review and reuse, including raw data, fragments, matrices, peak files, QC summaries, motif tables, annotated figures, and analysis reports.
References
Semi-automated IT-scATAC-seq profiles cell-specific chromatin accessibility in differentiation and peripheral blood populations
Transposition of native chromatin for fast and sensitive epigenomic profiling of open chromatin, DNA-binding proteins and nucleosome position
ArchR is a scalable software package for integrative single-cell chromatin accessibility analysis
Comprehensive analysis of single cell ATAC-seq data with SnapATAC
Best practices for differential accessibility analysis in single-cell epigenomics
Compliance / Disclaimer
For Research Use Only (RUO). This service is not intended for clinical diagnosis, medical interpretation, patient management, treatment guidance, or Direct-to-Consumer genetic testing.
Demo Results: What scATAC-seq Data Can Show
Demo results help you preview the kinds of outputs a scATAC-seq project can generate. The exact figures depend on sample quality, study design, organism, and analysis scope, but the result categories below are common in regulatory interpretation projects.
Cell Clustering and Accessibility-Based Annotation
A UMAP or t-SNE plot can show how cells or nuclei cluster based on chromatin accessibility patterns. Clusters may be annotated using accessibility patterns, marker peaks, gene activity scores, reference datasets, or integration with expression data.
Typical visual: UMAP colored by chromatin accessibility clusters and annotated cell types.
How we use it: To identify cell populations and organize downstream peak and motif analysis.
Peak Tracks and Regulatory Element Views
Genome browser-style peak tracks can show accessibility signals across cell clusters, sample groups, or selected genomic regions. These views are useful when researchers want to examine promoters, enhancers, or regions near genes of interest.
Typical visual: Peak tracks across clusters or conditions near representative loci.
How we use it: To connect regulatory regions with cell types, genes, or experimental groups.
Motif Enrichment and RNA/ATAC Integration
Motif enrichment analysis can identify transcription factor binding motifs enriched in accessible regions. When scRNA-seq data are available, integration can help connect accessibility with expression and cell identity.
Typical visual: Motif enrichment heatmap plus gene activity or RNA/ATAC integration panel.
How we use it: To prioritize transcription factors, regulatory programs, and follow-up hypotheses.
Compliance / Disclaimer
For Research Use Only (RUO). This service is not intended for clinical diagnosis, medical interpretation, patient management, treatment guidance, or Direct-to-Consumer genetic testing.
Literature Case Study: Cell-Specific Chromatin Accessibility in Differentiation and PBMCs
Source: Semi-automated IT-scATAC-seq profiles cell-specific chromatin accessibility in differentiation and peripheral blood populations
Background
Single-cell ATAC-seq is valuable for mapping chromatin accessibility at cell-level resolution, but method performance depends on nuclei handling, library complexity, indexing strategy, QC metrics, and analysis workflow. For studies of differentiation or mixed cell populations, these factors determine whether accessibility profiles can be interpreted as meaningful regulatory signals.
The 2025 Nature Communications study introduced a semi-automated indexed Tn5-based scATAC-seq workflow designed to profile cell-specific chromatin accessibility in differentiation systems and peripheral blood populations.
Methods
The study used indexed Tn5 tagmentation and a three-round barcoding strategy. Nuclei were isolated, transposed with indexed Tn5 complexes, sorted into 384-well plates, amplified with indexed PCR, sequenced, and analyzed for chromatin accessibility profiles.
The authors evaluated workflow performance using species-mixing experiments, replicate comparisons, TSS enrichment, nucleosome periodicity, UMAP clustering, cell population separation, motif enrichment, and differentiation-related regulatory changes.
Results
In Figure 1, the authors presented the IT-scATAC-seq workflow and benchmark. The study reported species-mixing accuracy of 98.72%, replicate correlation above 0.97, strong TSS enrichment, nucleosome periodicity, and UMAP-based separation of cell populations.
The paper also evaluated mouse embryonic stem cell differentiation. In the differentiation analysis, the authors reported 4,167 QC-passed cells, 131.81 million fragments, median TSS enrichment of 14.35, and median FRiP of 0.69. These results supported the method's ability to capture cell-specific chromatin accessibility during early differentiation.
Conclusion
This case illustrates why a scATAC-seq service needs more than sequencing capacity. Meaningful regulatory interpretation depends on nuclei handling, transposition quality, library complexity, QC metrics, clustering, accessible peaks, and motif analysis. For research teams, these QC and analysis layers are essential for turning chromatin accessibility data into interpretable regulatory evidence.
Compliance / Disclaimer
For Research Use Only (RUO). This service is not intended for clinical diagnosis, medical interpretation, patient management, treatment guidance, or Direct-to-Consumer genetic testing.
FAQs About Single-Cell ATAC-seq Service
What does scATAC-seq measure?
scATAC-seq measures chromatin accessibility at single-cell or single-nucleus resolution. It identifies regions of open chromatin that may include promoters, enhancers, and other regulatory elements.
How is scATAC-seq different from bulk ATAC-seq?
Bulk ATAC-seq measures average chromatin accessibility across a mixed sample. scATAC-seq separates accessibility patterns by individual cells or nuclei, making it better suited for heterogeneous tissues or mixed cell populations.
When should I choose scATAC-seq instead of scRNA-seq?
Choose scATAC-seq when your main question is about chromatin accessibility, regulatory elements, transcription factor motifs, or regulatory programs. Choose scRNA-seq when your main question is gene expression and cell-state mapping. Many projects benefit from using both.
What sample types can be used for scATAC-seq?
scATAC-seq projects may use high-quality cell suspensions, nuclei suspensions, blood or immune-cell samples, fresh tissue, frozen tissue, organoids, or sorted cell populations. Feasibility depends on sample quality, debris level, concentration, and nuclei or cell integrity.
What QC metrics matter most for scATAC-seq?
Important QC metrics may include cell or nuclei recovery, library complexity, fragment size distribution, unique fragments per cell, TSS enrichment, FRiP or peak-related metrics, barcode recovery, and peak quality.
What files and analysis outputs will I receive?
Typical deliverables include raw sequencing files, fragment files, peak sets, accessibility matrices, QC summaries, UMAP or t-SNE plots, clustering results, marker peak tables, motif enrichment results, annotation support, figure files, and an analysis report.
Can N2 Jenomics Lab Pvt. Ltd. support motif enrichment and gene activity analysis?
Yes. We can support motif enrichment, transcription factor activity inference, gene activity score calculation, peak-to-gene linkage, and differential accessibility analysis depending on your project design.
Can scATAC-seq be integrated with scRNA-seq?
Yes. Optional integration can support label transfer, joint embedding, gene activity comparison, and regulatory interpretation across chromatin accessibility and gene expression data.
Is scATAC-seq suitable for frozen tissue or nuclei input?
scATAC-seq can be compatible with nuclei-based workflows, but frozen tissue and nuclei input should be reviewed before project setup. Nuclei integrity, debris, clumping, and chromatin quality are key considerations.
What should I provide before requesting a project review?
Please provide sample type, species, tissue source, preservation method, expected cell or nuclei input, number of groups, replicate design, and the main regulatory question you want to answer.
Compliance / Disclaimer
For Research Use Only (RUO). This service is not intended for clinical diagnosis, medical interpretation, patient management, treatment guidance, or Direct-to-Consumer genetic testing.
Address:Registered Office: 150, Patparganj Industrial Area, New Delhi – 110092, India
Operational Address:National Institute of Plant Genome Research (BRIC - NGGF)
Lab No. 206 and 207, Aruna Asaf Ali Marg, P.O. Box No. 10531,
New Delhi – 110067, India