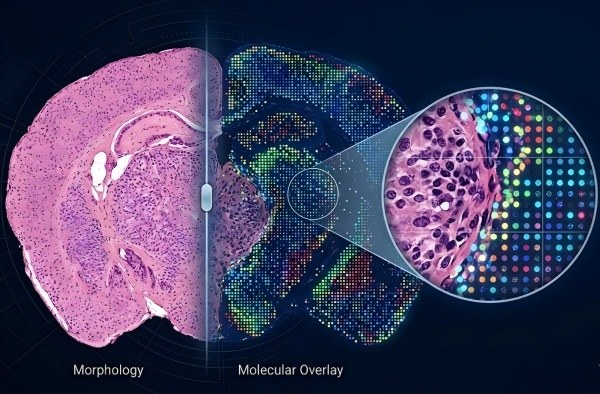
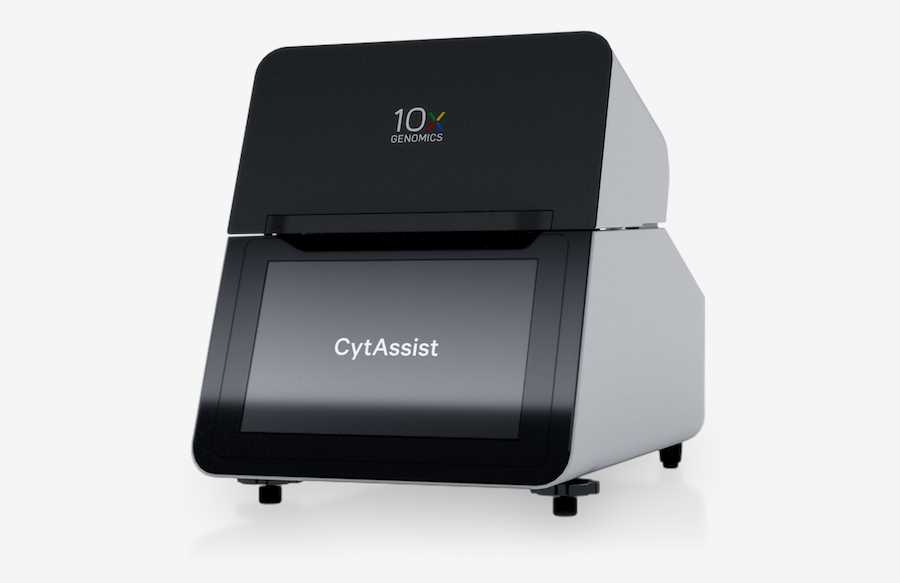
Map the whole transcriptome directly onto intact tissue sections. From standard Fresh Frozen to challenging FFPE samples, we deliver unbiased, high-resolution spatial gene expression data seamlessly integrated with tissue morphology to accelerate your basic research.
Core Technical Advantages:
Broad Sample Compatibility: Optimized sectioning and permeabilization protocols for FFPE, Fresh Frozen (FF), and Fixed Frozen (FxF) tissues, ensuring high RNA yield.
High-Resolution Unbiased Mapping: Comprehensive whole-transcriptome profiling across entire tissue sections (up to 6.5mm x 6.5mm), precisely aligning H&E or Immunofluorescence (IF) imaging with molecular expression.
End-to-End Analysis & Visualization: Turnkey bioinformatics solutions from raw data processing to customized spatial clustering and interactive Loupe Browser file delivery.
Spatial transcriptomics, an innovative approach for deep dissection of RNA-seq data in a spatial dimension, enables a comprehensive depiction of mRNA distribution within each individual tissue slice. This subsequently allows for the precise localisation and differential identification of actively expressed function genes within a specific tissue region. Given that cells, representing the basic units of an organism, operate their unique biological functions in collaboration with their spatially specific microenvironment, the mastery of spatial positioning information becomes paramount when investigating mechanisms in cell biology, oncology, and developmental biology.
Thanks to advancements in microscopic imaging technologies (including super-resolution and single molecule imaging), along with continuous improvements in multicolour fluorescence in situ hybridization techniques, our understanding of cell, tissue structure, and functions has grown exponentially. Simultaneously, the evolution of sequencing technologies has permitted precise quantitative and qualitative analyses of gene expression in previously unexplored cells or tissues. Spatial transcriptomics, by integrating microscopic imaging and sequencing technologies, retains as much spatial information of the sample as possible while procuring gene expression data. This offers scientists revolutionary findings with profound implications.
FFPE Spatial Transcriptomics Sequencing
With the continuous advancement and innovation in spatial transcriptomics technology, numerous technical challenges are being gradually overcome. Recently, 10X Genomics achieved a significant breakthrough by applying spatial transcriptomics to successfully address the limitations of Formalin-Fixed Paraffin-Embedded (FFPE) tissue sections in spatial gene expression analysis. This development provides robust support for further exploration of spatial information. The Visium spatial gene expression technology cleverly combines histology with high-throughput RNA sequencing, significantly broadening the types and scope of sample processing in single-cell sequencing technology. This provides a richer selection for research in fields such as pathophysiology, enabling comprehensive transcriptomic analyses of over 18,000 genes in humans and mice. This technology enables the in-depth investigation of any pathway gene expression, analysis of tissue heterogeneity, and revelation of cell types and states in different tissue morphological backgrounds.
10x Genomics Visium Spatial Transcriptomics Sequencing Service at N2 Jenomics Lab Pvt. Ltd.
N2 Jenomics Lab Pvt. Ltd. ' Spatial Transcriptomics Sequencing Service is a ground-breaking technique, utilizing the advanced 10x Visium platform, that enables precise in-situ transcriptional profiling of complete gene expression within tissues. This approach provides detailed insights into not only the levels of gene expression but also locates precisely where genes are expressed within the tissue space. This procedure enables us to directly observe and compare differential gene expressions in various functional regions within tissues. By doing so, it offers a potent tool for in-depth exploration of tissue functions and disease mechanics, thereby amplifying our capacity to delve into the mechanics of health and disease.
The key to the technology behind spatial gene expression solutions lies in the slide section. Serving as a foundation for library construction, each slide is patterned with four precise capture areas, each measuring 6.5 x 6.5 millimeters and displayed in a quadrangular frame. Nested within each capture area are 5000 barcode-tagged spots, each with a 55-micrometer diameter and a center-to-center distance of 100 micrometers between adjacent spots. Every spot carries a unique barcode sequence – a spatial barcode – employed to identify and differentiate the discrete spots. Moreover, each nucleic acid probe within a spot has an exclusive unique tag to distinguish varied transcripts within a single cell and eradicate PCR duplications, thereby achieving absolute quantification.
Upon the release of RNA from the cells in the tissue section, they migrate to each aforementioned spot and are attributed with corresponding barcode sequences. Subsequent to this, the RNA goes through the processes of library construction and sequencing. Harnessing the barcode information from the probe data, we can allocate the data accurately to its relevant location, establishing the origins of the data from specific spatial coordinates. Ultimately, this process accomplishes the visualization of spatial gene expression.
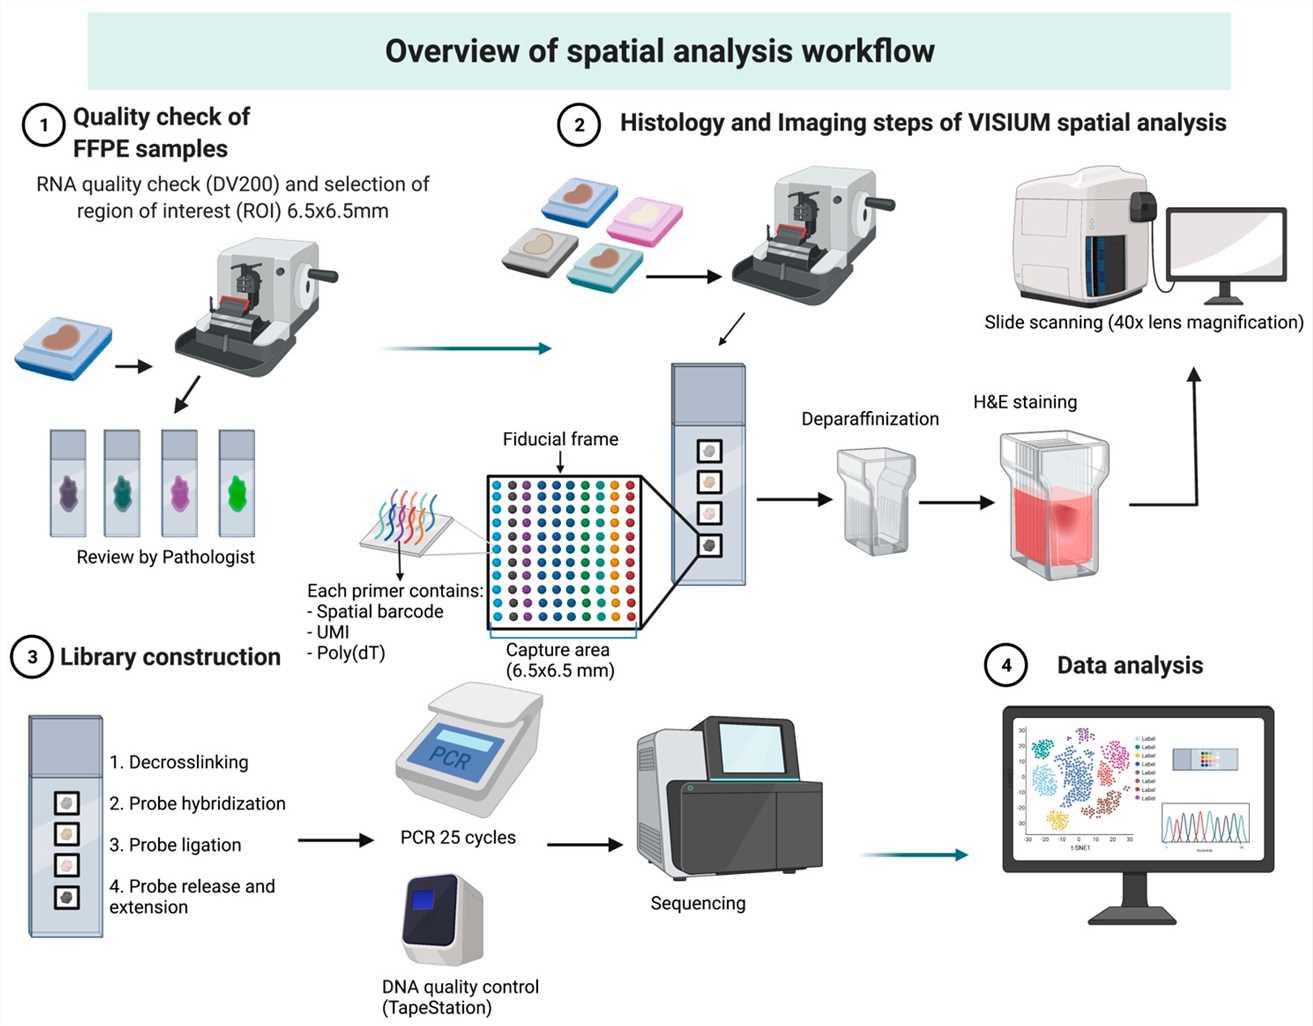
Overview of Visium spatial analysis workflow. (Dmitrii Shek et al,. Methods Protoc. 2023)
Precision slicing of fresh-frozen tissue samples is carried out, followed by visualization using advanced imaging techniques.
The tissue sections are positioned on a specially designed slide coated with RNA-specific capture probes. Following stringent fixation and permeabilization steps, mRNA from within the cells are ensured to be fully released and specifically bound to the capture probes, leading to an accurate capture of gene expression information.
Captured RNA serves as the template for precise cDNA synthesis and sequencing library preparation, ensuring the accuracy and reliability of subsequent analysis.
The prepared sequencing libraries undergo efficient sequencing for a comprehensive capture of gene expression information.
Through data visualization analysis we precisely determine the genes that are expressed, quantify them, and further interpret their spatial positioning information.
Spatial Transcriptomics Sequencing Service Workflow
Visium Spatial Gene Expression for Fresh Frozen Tissue Service Workflow
Visium Spatial Gene Expression for FFPE Service Workflow
Service Specification
Sample requirements Fresh Tissue: 6.5mm^3 FFPE: 6.5mm^3; DV200 > 50% Species Range: Human, Mouse, Rat. For other species, please consult.
Sequencing Sequencing Platform: Illumina NovaSeq 6000 Sequencing Pattern: PE150 Sequencing Data Volume: ≥50k read pairs per spot.
Bioinformatics Analysis We provide customized bioinformatics analysis including: Raw sequence data Sequencing data quality assessment and filtering Spot quality control Data alignment Data standardization Spot clustering Spot subpopulation analysis Marker analysis Cell type identification Anatomical region annotation Cell communication analysis Inter-sample differential analysis Inter-annotation region differential analysis
Sample Preparation
It is imperative to mention a crucial precaution in the sample preparation process, specifically for tissue samples. It is advisable to avoid snap-freezing in liquid nitrogen, as the rapid cooling can potentially cause harm to cell structures. Instead, the use of pentane embedded with OTC for quick freezing of tissue samples is officially recommended by 10X Genomics. Throughout the practical application, many researchers frequently encounter difficulties in the step of suspension preparation during single-cell experiments. Despite repeated attempts at digestion processing, obtaining a single-cell suspension that meets the requirements for machine usage is still arduous. Even if one proceeds with machine operation reluctantly, there might be risks of suboptimal cell conditions, insufficient cell capture, and the complication of multicellular muddling. Comparatively, the workflow of spatial transcriptomics experiments is somewhat streamlined. Under the guidance of accomplished companies, after conducting reasonable freezing of tissue samples, subsequent steps of tissue clarification, staining, fixation, clarification, library construction, sequencing, and analysis etc, can all be entrusted to professional companies. This could save researchers a considerable amount of time.
Service Advantages
Superior Quality Slicing: With extensive experience in slicing and mounting, we have developed optimized solutions for different tissues.
Automated Analysis: Our well-established analysis procedure offers fast and accurate interpretation of spatial transcriptome data.
Standardized Quality Control: Our wealth of practical experience has led to the development of a standardized quality control system.
Professional Team: Our renowned technical team has years of experience in project plan design, lab operations, and after-sales analysis.
Full-Service Approach: We provide a comprehensive range of services spanning tissue cryopreservation and embedding, mounting, slicing, clearing, library construction and sequencing, as well as data analysis.
Demo Results
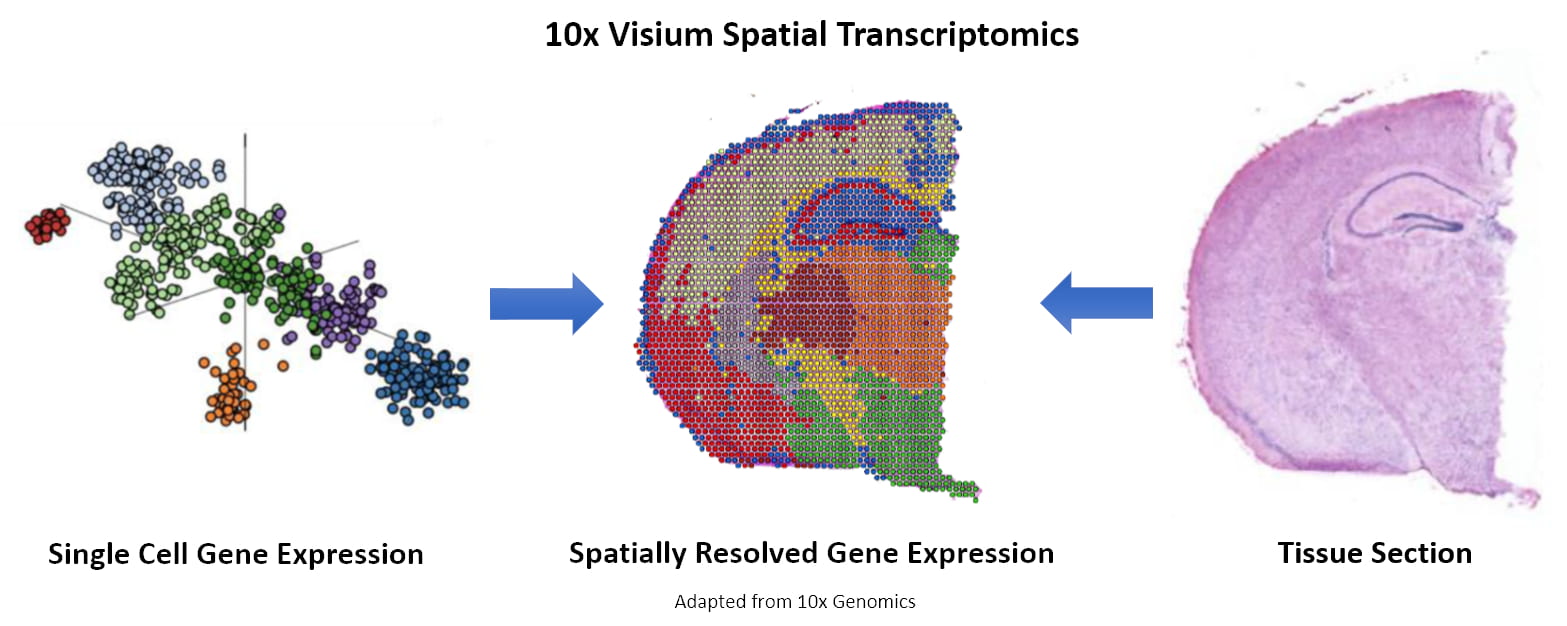
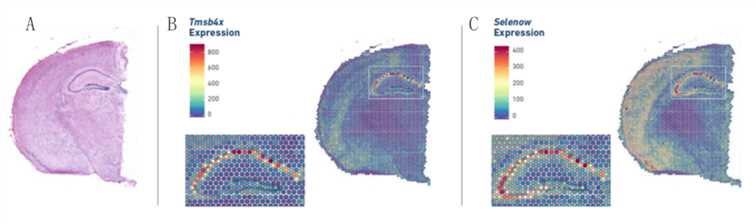
Figure 1. Spot clustering and image integration. (Source: 10x Genomics)
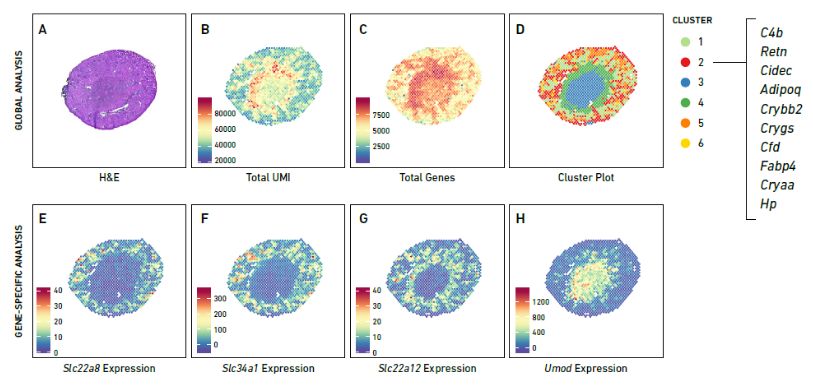
Figure 3. mRNA expression and clustering map of spatial transcriptome. (Source: 10x Genomics)
10x Spatial Transcriptome Seq FAQs
1. What types of tissue materials can we process?
Primarily, our Visium Spatial Gene Expression solution facilitates the examination of human and mouse tissue samples, particularly those in block form or attached to glass slides, whether stained or unstained.
2. How large are the individual positions on the Visium Spatial Slide?
The diameters of the spots measure 55 µm.
3. Does Visium offer an approach for single-cell resolution?
Although each 55 µm spot on our current Visium setup captures approximately 10 cells, our bioinformatics strategy allows us to deconvolve data for examination at a single-cell level.
4. How is the capture area on the Visium Spatial Slide organized?
The available configurations for the capture area are either 6.5mm x 6.5mm or 11mm x 11mm.
10x Spatial Transcriptome Seq Case Studies
Spatial mapping reveals human adipocyte subpopulations with distinct sensitivities
Journal: Cell metabolism
Impact factor: 27.287
Published: 7 September 2021
Background
White adipose tissue (WAT) regulates energy balance through lipid storage and secretion of factors. Its plasticity involves various cell types, with healthy WAT expansion needing vascularity, adipocyte formation, and immune responses, while unhealthy WAT shows hypertrophy and chronic inflammation, leading to metabolic diseases. Spatial transcriptomics combined with single-cell RNA sequencing has identified three distinct adipocyte populations in human WAT, each with different hormonal responses, highlighting the importance of adipocyte heterogeneity in hormonal sensitivity.
Materials & Methods
Sample Preparation
Human subjects
Subcutaneous adipose tissue samples
Sequencing
10x Spatial Transcriptome Sequencing
Illumina NovaSeq6000 platform
Data Analysis
Sequence data processing
Image-based fat cell size assessments
Analyses of expression profiles and pathways
Analyses of adipocyte subtype marker genes
Results
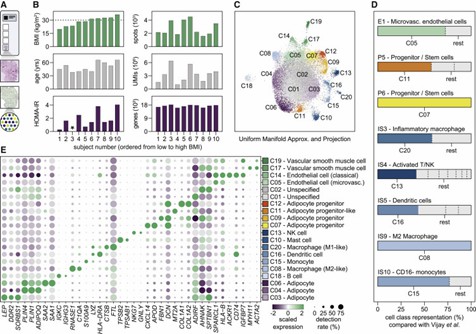
Using the 10x Genomics Visium Spatial Gene Expression platform, the authors analyzed subcutaneous abdominal WAT from ten individuals. They identified 20 distinct cell classes, including immune, vascular, and progenitor cells. The combination of spatial transcriptomics and single-cell RNA sequencing revealed three mature adipocyte classes with unique gene signatures. These findings highlight the cellular heterogeneity and spatial organization within WAT, enhancing the understanding of its complex structure and function.
Figure 1. Integrative analyses of spatial and single-cell transcriptomic data identify 18 distinct cell classes in human WAT.
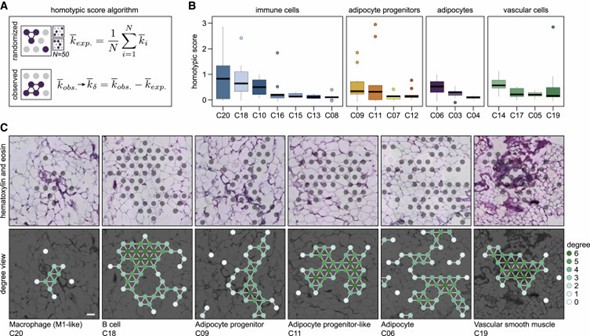
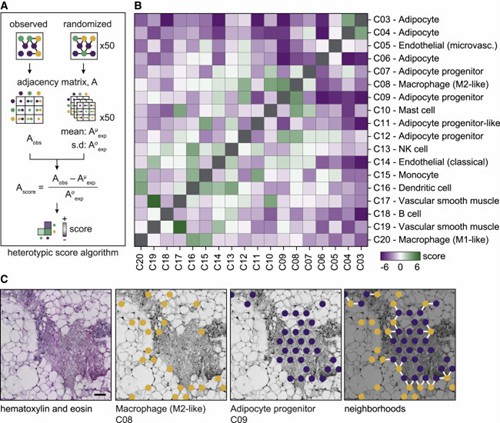
The authors systematically analyzed the cellular organization of white adipose tissue (WAT) and discovered that cells form both homotypic and heterotypic clusters. Immune cells, adipocyte progenitors, and vascular cells exhibited varying degrees of homotypic clustering. Additionally, the study revealed spatial relationships between different cell classes. These findings highlight the complex and spatially defined cell-cell relationships within WAT.
Figure 2. WAT resident cells display large variations in the propensity to form homotypic cell clusters.
Figure 3. Specific cell populations display heterotypic clusters in WAT.
Conclusion
The authors used high-resolution spatial transcriptomics to map human white adipose tissue (WAT), identifying 18 distinct cell classes, including adipocyte progenitors, immune, vascular, and mature fat cells. They developed algorithms to uncover homotypic and heterotypic cell clusters, showing that WAT is more structurally organized than previously thought. Notably, they found that only one of the three identified mature adipocyte populations responded significantly to hormonal stimulus. This work enhances our understanding of WAT's cellular architecture and its impact on hormonal sensitivity, providing a valuable resource for further research.
Reference
Bäckdahl J, Franzén L, Massier L, et al. Spatial mapping reveals human adipocyte subpopulations with distinct sensitivities. Cell metabolism, 2021, 33(9): 1869-1882. e6.
Address:Registered Office: 150, Patparganj Industrial Area, New Delhi – 110092, India
Operational Address:National Institute of Plant Genome Research (BRIC - NGGF)
Lab No. 206 and 207, Aruna Asaf Ali Marg, P.O. Box No. 10531,
New Delhi – 110067, India