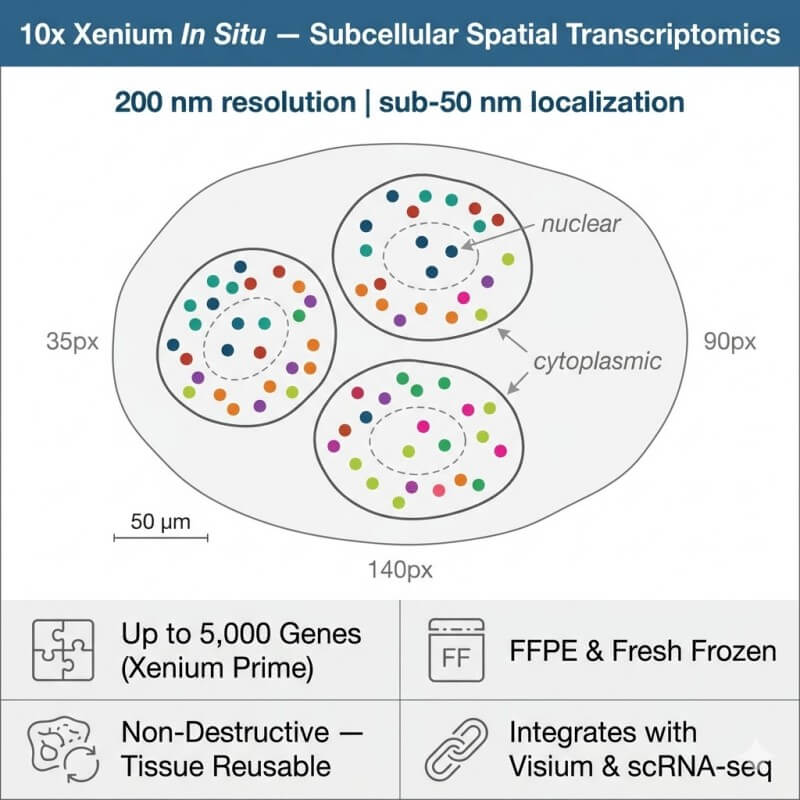
Xenium In Situ is 10x Genomics' imaging-based spatial transcriptomics platform, launched commercially in 2023. Unlike sequencing-based approaches such as Visium HD and Visium FF — which capture and sequence RNA from barcoded arrays — Xenium detects individual transcript molecules directly in their native location within the tissue using fluorescently labeled probes imaged at subcellular resolution. Each transcript's position is recorded as an exact X-Y-Z coordinate, and DAPI nuclear staining combined with cell boundary expansion algorithms assigns every detected transcript to a specific segmented cell.
The Xenium detection mechanism uses circularizable padlock probes specific to target transcripts. After probe hybridization within the tissue section, target-bound probes are ligated and amplified by rolling circle amplification (RCA), creating a bright, spatially stable fluorescent amplicon (called a "rolling circle product" or RCP) at the exact location of the original transcript. The Xenium Analyzer then images these RCPs across the tissue in multiple imaging cycles — each cycle reading a subset of probes using spectrally distinct fluorescent reporters — and decodes the resulting optical signatures to call each transcript identity. This process is completed entirely on the instrument, with onboard data processing delivering cell-by-gene expression matrices and spatial coordinate tables directly at run completion.
The Xenium Analyzer images a 10.45 × 22.45 mm area — large enough to accommodate multiple tissue sections per slide. Up to 5,000 genes can be profiled per run using the Xenium Prime panel architecture, which allows mixing of catalog subpanels (cancer, immunology, neuroscience, development) or incorporation of custom probes targeting researcher-specified genes. Critically, the Xenium assay is non-destructive to tissue: after the run completes, the tissue section remains available for downstream H&E staining, immunofluorescence (IF) protein detection, or — in a particularly powerful combination — a subsequent spatial transcriptomics run on the same section using Visium CytAssist.
Xenium vs. Sequencing-Based Spatial Methods
Xenium's imaging-based single-molecule detection delivers capabilities that sequencing-based methods cannot match — particularly for subcellular localization, true single-cell resolution without deconvolution, and tissue morphology correlation.
Feature
Visium FF (55 µm spots)
Visium HD (2 µm bins)
Xenium In Situ (This Service)
Detection technology
Sequencing (poly(A) capture)
Sequencing (probe-based)
Imaging (padlock probe + RCA)
Spatial resolution
55 µm (multicellular)
2 µm bins (single-cell scale)
200 nm optical; sub-50 nm localization
Transcript-level coordinates
Spot-level (binned)
Bin-level (2–16 µm)
Exact X-Y-Z per molecule
Cell assignment method
Computational deconvolution
Segmentation or deconvolution
Direct DAPI + cell boundary segmentation
Subcellular localization
✗
Partial (2 µm bins)
✓ — nuclear vs. cytoplasmic compartments
Transcriptome coverage
Whole transcriptome (unbiased)
~18,000 human / ~20,000 mouse genes
Targeted panel (up to 5,000 genes)
Novel gene discovery
✓
✓
✗ — panel-defined targets only
Sample compatibility
Fresh frozen
FFPE, FF, fixed frozen
FFPE and fresh frozen
Tissue reusability post-run
✗ — tissue consumed in library prep
✗ — tissue consumed
✓ — non-destructive; tissue reusable for H&E, IF, Visium
Xenium offers a catalog of pre-designed panels for major research domains, with the flexibility to add custom probes targeting your specific genes of interest. All panels are available for human tissue; selected panels are validated for mouse.
Xenium Prime 5K Panels — Comprehensive Multi-Domain Profiling
Up to 5,000 genes per run via combinable subpanels
Available subpanels: Cancer (solid tumor, hematologic), Immunology & Inflammation, Neuroscience, Development & Cell Fate, Metabolism
Mix and match subpanels to build a project-specific 5K panel
Human (primary) and mouse (selected subpanels) validated
Best for: comprehensive cell-type mapping, TME profiling, multi-biology studies
Xenium Organ-Specific & Pathology Panels
Tissue-specific panels: Human Breast (313 genes), Human Brain (285 genes), Human Lung (315 genes), Human Colon (300+ genes), and others
Designed and validated for each organ's major cell types and disease-relevant markers
Complementary protein detection panels (Xenium Protein) available for selected immune markers
Best for: focused organ biology, validated biomarker panels, clinical research cohorts
Custom Probe Addition
Add custom probes targeting researcher-specified genes to any catalog panel
Minimum 1 gene, maximum dependent on total panel size remaining
Lead time: 4–6 weeks for custom probe synthesis and QC
Validated against tissue-specific background before delivery
Best for: adding proprietary biomarkers, novel gene targets, or species-specific sequences
Multi-Modal Xenium + IF Protein Co-Detection
After the Xenium RNA run, the same tissue section can be stained with antibody panels for simultaneous protein + RNA spatial profiling
Compatible with standard IF antibodies for cell surface and intracellular markers
DAPI staining is already part of the standard Xenium workflow — no additional nuclear prep required
Best for: correlating RNA expression with protein levels, validating antibody targets spatially, multi-omics tissue characterization
Service Workflow
Xenium's onboard processing delivers data directly at run completion — the fastest turnaround of any spatial transcriptomics platform for targeted panel studies.
Step 1 — Panel Selection & Sample QC: We work with you to select the most appropriate Xenium panel for your biological question — catalog panel, organ-specific panel, or a customized combination with additional probes. Tissue blocks (FFPE or fresh frozen OCT) are assessed for quality: DV200 ≥ 30% for FFPE; RIN ≥ 7 for fresh frozen. The Xenium Analyzer imaging area (10.45 × 22.45 mm) accommodates multiple tissue sections per run, which we plan to maximize for cost efficiency.
Step 2 — Tissue Sectioning & Probe Hybridization: Tissue is sectioned at 5 µm (FFPE) or 10 µm (fresh frozen) onto Xenium-specific slides with pre-coated surface chemistry. DAPI nuclear staining is applied. Target-specific padlock probes are hybridized to transcripts within the tissue at their exact spatial positions. After hybridization, probes are ligated to circularize around their targets and amplified by rolling circle amplification (RCA) — creating bright, spatially stable fluorescent amplicons at each transcript's native location. No library preparation or sequencing is required.
Step 3 — Xenium Analyzer Cyclic Imaging & Onboard Decoding: The Xenium Analyzer performs automated cyclic fluorescence imaging of the tissue section. In each imaging cycle, a subset of probes fluoresce in spectrally distinct channels; across all cycles, each target generates a unique optical barcode (sequence of fluorescence signals). The Xenium instrument decodes these barcodes in real time, assigns each detected fluorescence spot to a transcript identity, and records its exact X-Y-Z coordinates. A single 5,000-gene panel run completes in approximately 6 days or fewer; smaller panels are faster.
Step 4 — Cell Segmentation & Spatial Data Processing: DAPI nuclear staining images are used to segment individual nuclei using Xenium Ranger's built-in nuclear segmentation algorithm. Cell boundaries are defined by expanding nuclei masks to the expected cell size (or using cell membrane staining when IF co-detection is performed). Every detected transcript is assigned to the cell whose boundary contains it — yielding a true cell-by-gene count matrix with no deconvolution required.
Step 5 — Bioinformatics Analysis & Results Delivery: Xenium Ranger output files are processed through established spatial analysis tools for cell-type clustering, spatial neighborhood analysis, and cell-cell interaction inference. When Xenium data is combined with matched single-cell RNA sequencing or Visium data from the same sample, integrated multi-modal analysis is performed. All deliverables are described in the Bioinformatics section below.
Get Your Instant Quote
Key Applications
Xenium In Situ is the platform of choice when subcellular transcript localization, exact cell boundary definition, or tissue-non-destructive multi-modal profiling is the scientific priority.
1
Subcellular Transcript Localization
Xenium's sub-50 nm localization precision resolves whether transcripts are in the nucleus, cytoplasm, or at the cell membrane — a distinction invisible to any sequencing-based spatial method. This subcellular compartmentalization has direct biological relevance: nuclear retention of certain RNA species, perinuclear translation of secretory proteins, and membrane-proximal signaling transcript enrichment are all spatially deterministic events that Xenium captures in their native context.
Xenium resolves individual immune cell types — cytotoxic T cells, macrophage subtypes, regulatory T cells, NK cells, dendritic cells — at their exact positions within the tumor microenvironment, without the deconvolution assumptions required by Visium-based approaches. Cell-cell proximity analysis identifies which immune cell types are spatially associated with tumor cells and defines immunological spatial niches that predict clinical outcomes.
3
Validated Biomarker Panel Profiling in Clinical Cohorts
For researchers with an established hypothesis and a defined set of target genes, Xenium's panel-based approach is more efficient than whole-transcriptome methods. FFPE compatibility enables retrospective analysis of biobanked clinical specimens — applying validated gene panels to large patient cohorts to correlate spatial expression patterns with clinical metadata, treatment responses, and pathological diagnoses.
The most comprehensive spatial biology workflow combines whole-transcriptome spatial discovery (Visium HD or Visium FF) with Xenium In Situ validation on adjacent sections. Visium identifies unexpected gene expression patterns and novel cell states across the full transcriptome; Xenium then validates and spatially resolves specific markers from the discovery findings at subcellular precision. Our spatial multi-omics services offer integrated project management for this combined workflow.
5
Neuroscience & Brain Cytoarchitecture
The brain's densely packed, morphologically diverse neurons demand subcellular resolution to identify cell types based on their transcript composition and spatial organization. Xenium Brain panels resolve neuronal subtypes, interneuron identities, glial cell states, and synaptic marker localization at the level of individual cells within the laminar architecture of cortex, hippocampus, cerebellum, and other brain regions — in both mouse and human fresh frozen or FFPE tissue.
Sample Requirements
Xenium is validated for FFPE and fresh frozen tissue. Sample quality directly determines transcript detection sensitivity — contact us before sample collection for tissue-type-specific preparation guidance.
Sample Format
Section Thickness
Quality Requirement
Shipping
Notes
FFPE tissue block
5 µm
DV200 ≥ 30% (minimum); ≥ 50% preferred
Room temperature (block); ship sections on glass slides if pre-cut
Deparaffinization, decrosslinking, and protease treatment performed in-house; do not pre-treat sections before shipping
Fresh frozen OCT block
10 µm
RIN ≥ 7 recommended; ≥ 6 minimum
Dry ice
Submit blocks; sections must be cut fresh. Tissue must be OCT-embedded; other cryoprotectants may interfere with probe hybridization
Imaging area: The Xenium slide imaging area is 10.45 × 22.45 mm. Multiple tissue sections can be placed within this area — we optimize section placement to maximize tissue coverage and enable comparison of multiple conditions or timepoints in a single run.
Species: Human tissue is supported by all catalog panels. Mouse tissue is supported by selected panels (Human Breast 313-gene panel has shown cross-reactivity with mouse; dedicated Mouse Brain and Pan-Tissue panels available). Other species require custom probe design — contact us for feasibility assessment.
Panel selection timeline: Custom probe synthesis for non-catalog targets requires 4–6 weeks. Standard catalog panels are available for immediate run scheduling. We recommend confirming panel selection before sample submission to avoid delays.
Non-destructive tissue note: After the Xenium run, the tissue section remains physically intact. Sections can be used for downstream H&E staining, IF antibody staining, or archived. We can coordinate downstream Visium CytAssist processing on the same section upon request.
Bioinformatics Analysis & Deliverables
Xenium Ranger onboard processing delivers primary outputs directly at run completion. Our downstream bioinformatics pipeline adds cell-type classification, spatial neighborhood analysis, and multi-modal integration as standard deliverables.
Xenium Ranger Primary Outputs: Transcript coordinate table (X, Y, Z per detected molecule + transcript identity); cell segmentation masks (nucleus + cell boundary); cell-by-gene count matrix; DAPI and morphology images; per-cell QC metrics (total transcripts per cell, cell area, nucleus area).
QC Report: Per-run and per-section metrics — transcript detection rate per gene, median transcripts per cell, cell segmentation efficiency, blank probe negative control signal, background fluorescence assessment.
Cell Type Classification: Unsupervised clustering of cells using Seurat or Squidpy applied to the cell-by-gene matrix; marker gene-based cell type annotation; spatial maps of cell type distributions overlaid on DAPI image.
Ligand-Receptor Interaction Analysis: CellChat or NicheNet-based inference of intercellular signaling between spatially proximate cell types — using exact cell coordinate proximity rather than bulk deconvolution estimates.
Subcellular Localization Maps: Per-gene visualization of transcript distribution across nuclear vs. cytoplasmic compartments; transcript density heatmaps at subcellular resolution for selected genes.
Multi-Modal Integration (when applicable): If matched scRNA-seq or Visium HD data are provided, integrated analysis uses label transfer, co-embedding, or anchor-based alignment to enhance cell type resolution and provide cross-platform concordance assessment.
All visualization files are delivered in publication-ready PDF/PNG format and Xenium Explorer interactive format. Extended analyses — trajectory modeling, spatial domain mapping, and custom panel QC reports — are available as add-on services.
References
Janesick A, Shelansky R, Gottscho AD, et al. High resolution mapping of the tumor microenvironment using integrated single-cell, spatial and in situ analysis. Nat Commun. 2023;14:8353. https://doi.org/10.1038/s41467-023-43458-x
Ren P, Sheng W, Peng X, et al. Systematic benchmarking of high-throughput subcellular spatial transcriptomics platforms across human tumors. Nat Commun. 2025;16:9649. https://doi.org/10.1038/s41467-025-64292-3
For Research Use Only. Not for use in diagnostic or clinical procedures.
Demo Results
Xenium In Situ spatial cell type map of human breast cancer FFPE tissue (313-gene panel). Individual transcript molecules are shown as colored dots at their exact XYZ positions; cell boundaries (white outlines) are derived from DAPI-based segmentation. Distinct cell types are resolved at subcellular resolution without deconvolution. (Janesick A et al., Nat Commun, 2023)
Subcellular transcript localization in individual cells — Xenium's sub-50 nm localization precision resolves nuclear vs. cytoplasmic transcript distributions for selected marker genes. Each dot represents one detected molecule at its exact spatial position within the segmented cell boundary. (Janesick A et al., Nat Commun, 2023)
10x Xenium In Situ FAQs
1. When should I choose Xenium over Visium HD for my spatial project?
The choice between Xenium and Visium HD depends on your primary scientific objective. Choose Xenium when you need: (a) exact subcellular transcript localization (nuclear vs. cytoplasmic compartmentalization); (b) true single-cell assignment without deconvolution — Xenium assigns each transcript to a segmented cell directly from the DAPI image; (c) a validated targeted gene panel approach rather than unbiased whole-transcriptome discovery; or (d) non-destructive tissue processing — your tissue section remains available after the Xenium run for further IF staining or Visium processing. Choose Visium HD when unbiased whole-transcriptome coverage is the priority, when working with FFPE samples where RNA quality limits probe sensitivity, or when single-cell-scale resolution is sufficient without requiring exact subcellular compartmentalization. Many projects benefit from both: Visium HD for discovery, Xenium for validation.
2. What is the difference between Xenium and Xenium Prime — how many genes can I profile?
The original Xenium platform offered gene panels typically in the range of 300–500 genes per run. Xenium Prime, launched in 2024, expanded this to up to 5,000 genes per run through a modular subpanel architecture. Researchers can select one or more subpanels from available catalog options (Cancer, Immunology, Neuroscience, Development, Metabolism) and combine them up to the 5,000-gene total — or add custom probes to reach the panel limit. N2 Jenomics Lab Pvt. Ltd. offers both standard Xenium and Xenium Prime runs depending on project requirements.
3. Can Xenium be used with non-human species?
Catalog Xenium panels are validated for human tissue, with selected panels validated for mouse. For other species — rat, zebrafish, non-human primates, or agricultural animals — custom probe design is required. Custom probes can be designed against any target sequence, allowing Xenium to be adapted to most organisms with an annotated transcriptome. Custom probe synthesis requires 4–6 weeks of lead time. Contact our scientific team to discuss species-specific feasibility and panel design.
4. Is the tissue destroyed by the Xenium run — can I use it for subsequent staining?
No — Xenium is non-destructive to tissue. Unlike sequencing-based spatial methods (Visium, Stereo-seq) where the tissue is consumed during library preparation, the Xenium assay leaves the tissue section physically intact after the imaging run. Post-Xenium, the tissue can be used for: standard H&E staining and re-imaging; immunofluorescence (IF) antibody panel staining for protein co-detection; or — in a particularly powerful multi-platform workflow — a subsequent Visium CytAssist run for whole-transcriptome spatial profiling on the same section. We can coordinate all downstream tissue processing steps as part of an integrated spatial multi-omics project.
5. How does Xenium's cell segmentation work — does it require special reagents?
Xenium's standard segmentation uses DAPI nuclear staining, which is included in the standard Xenium workflow at no additional reagent cost. The Xenium Ranger software segments nuclei from DAPI images and expands nuclear masks outward by a defined distance (typically 15 µm) to approximate cell boundaries — a method that works well for most tissue types. For improved cell boundary accuracy in tissues where cells are closely packed or irregularly shaped, Xenium supports supplemental whole-cell staining using pan-cytokeratin antibodies (for epithelial cells) or other cell-type-specific membrane markers — available as an optional add-on to the standard workflow.
10x Xenium In Situ Case Studies
Published Research Highlight
High Resolution Mapping of the Tumor Microenvironment Using Integrated Single-Cell, Spatial and In Situ Analysis
Understanding the spatial organization of cell types within tumor microenvironments has long required a trade-off: bulk and single-cell sequencing provide transcriptome-wide molecular identities but lose spatial context; conventional spatial methods provide positional information but lack single-cell or subcellular resolution. Janesick et al. (10x Genomics) developed and demonstrated the Xenium In Situ platform on human breast cancer tissue — integrating Xenium In Situ, Visium spatial gene expression, and single-cell RNA sequencing in an end-to-end multi-platform workflow to achieve the most complete spatial molecular characterization of the breast tumor microenvironment to date.
Materials & Methods
Sample Preparation
Human breast cancer FFPE tissue sections (invasive ductal carcinoma)
Serial sections from the same tumor block for multi-platform comparison
Matched fresh frozen section for scRNA-seq reference generation
Platforms Used
Xenium In Situ (313-gene Human Breast Panel) — primary in situ platform
10x Chromium single-cell RNA-seq — cell type reference atlas
Analysis
Xenium Ranger cell segmentation and transcript assignment
Multi-platform data integration (Xenium + Visium + scRNA-seq)
Cell-cell interaction analysis in spatial context
Subcellular transcript localization validation
Results
Subcellular-Resolution Cell Type Mapping of Breast TME
Xenium's 313-gene panel resolved 17 distinct cell populations in the breast tumor microenvironment at single-cell resolution — including multiple tumor epithelial subtypes, macrophage populations, T cell subsets, fibroblast states, and vascular endothelial cells — each assigned to a precisely segmented cell with exact spatial coordinates (Fig. 1).
Individual transcript molecules were detected at their exact subcellular positions — nuclear vs. cytoplasmic localization of specific mRNAs was directly observable, a capability without precedent in array-based spatial methods.
Fig. 1 — Xenium In Situ spatial cell type map of human breast cancer FFPE tissue: 313-gene panel, single-molecule transcript detection with DAPI segmentation, 17 distinct cell types resolved at subcellular resolution. (Janesick A et al., Nat Commun, 2023)
Multi-Platform Integration Delivers Superior Resolution
Integration of Xenium with matched scRNA-seq data enabled label transfer — propagating whole-transcriptome cell type annotations from 10,000-gene scRNA-seq to Xenium's 313-gene panel, substantially improving the granularity of cell-type classification in spatial data.
Xenium data was combined with Visium spatial gene expression to map whole-transcriptome expression context around Xenium-resolved cell types — demonstrating how the two platforms provide complementary layers of spatial information from the same tumor.
Cell-Cell Interaction Analysis at True Spatial Resolution
Using exact cell coordinate proximity from Xenium data, the study performed ligand-receptor interaction analysis between spatially adjacent cell types — identifying specific immune-tumor cell communication axes at the tumor invasive edge that were spatially restricted to within 50 µm of the tumor boundary.
These spatially restricted interactions — including T cell-tumor cell co-localization patterns and macrophage polarization gradients — were only resolvable using single-cell spatial data with exact cell positions, not by deconvolution-based Visium-only approaches.
Conclusion
This landmark study demonstrated the full power of the Xenium In Situ platform — resolving 17 breast TME cell types at subcellular resolution, integrating with scRNA-seq for enhanced annotation, and performing spatially precise cell-cell interaction analysis that deconvolution-based methods cannot achieve. The multi-platform workflow demonstrated here (Xenium + Visium + scRNA-seq) is directly available through N2 Jenomics Lab Pvt. Ltd. ' integrated spatial multi-omics service offering, enabling research teams to replicate and extend this approach on their own tumor tissue collections.
Reference
Janesick A, Shelansky R, Gottscho AD, et al. High resolution mapping of the tumor microenvironment using integrated single-cell, spatial and in situ analysis. Nat Commun. 2023;14:8353. https://doi.org/10.1038/s41467-023-43458-x
Address:Registered Office: 150, Patparganj Industrial Area, New Delhi – 110092, India
Operational Address:National Institute of Plant Genome Research (BRIC - NGGF)
Lab No. 206 and 207, Aruna Asaf Ali Marg, P.O. Box No. 10531,
New Delhi – 110067, India