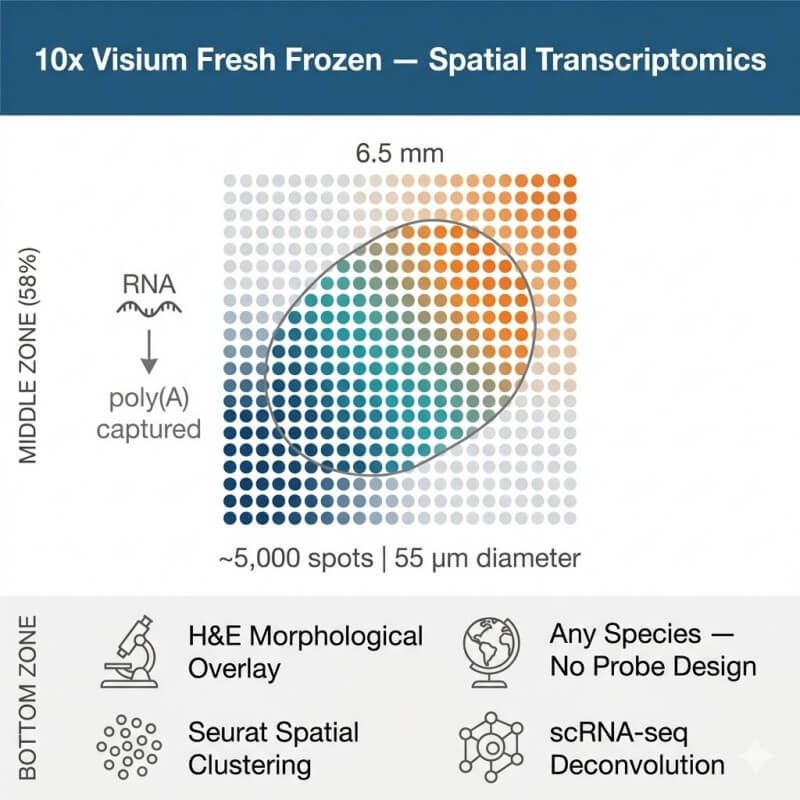
N2 Jenomics Lab Pvt. Ltd. delivers 10x Genomics Visium Fresh Frozen (FF) spatial transcriptomics, the gold-standard poly(A) capture-based method for mapping whole-transcriptome gene expression across intact tissue sections. Visium FF preserves the spatial organization of RNA at ~55 µm spot resolution across ~5,000 barcoded capture spots per 6.5 × 6.5 mm capture area — while simultaneously imaging H&E-stained tissue morphology for direct correlation of gene expression with histological structure.
Unbiased whole-transcriptome capture — no pre-designed probe panel required
Compatible with any species with a reference transcriptome
H&E morphological overlay linking expression clusters to tissue architecture
Full bioinformatics: Space Ranger, Seurat, cell deconvolution, and trajectory analysis
What Is 10x Visium Fresh Frozen Spatial Transcriptomics
The 10x Genomics Visium Spatial Gene Expression platform maps gene activity across intact tissue sections by capturing and sequencing poly(A)-tailed mRNA directly from spatially barcoded spots on a glass slide. The Fresh Frozen (FF) workflow uses the direct placement method: a cryosectioned tissue slice is mounted directly onto the Visium capture array, enabling unbiased whole-transcriptome profiling without the pre-designed probe panels required for FFPE workflows — making it uniquely suited for spatial transcriptomics research in any species with a reference genome.
Each Visium capture slide contains four 6.5 × 6.5 mm capture areas (or two 11 × 11 mm areas on the large format slide). Within each area, approximately 5,000 barcoded spots — each 55 µm in diameter with a 100 µm center-to-center spacing — capture poly(A)-tailed RNA from the overlying tissue. Each spot thus receives RNA from a region containing an average of 1 to 10 cells, depending on cell size and tissue density. After tissue permeabilization releases RNA from cells, in situ reverse transcription anchors cDNA to the spatial barcodes on the slide surface. The resulting spatially indexed cDNA is amplified and converted into Illumina-compatible libraries.
The critical advantage of the FF direct placement workflow over probe-based FFPE approaches is its complete lack of bias: every polyadenylated transcript in the tissue is captured proportionally to its abundance, with no target selection at the library preparation stage. This makes Visium FF the preferred approach for discovery experiments — novel cell type identification, de novo spatial domain mapping, and cross-species transcriptomics — where unbiased whole-transcriptome coverage is scientifically essential. For a broader comparison of RNA-seq technologies, see our transcriptome sequencing resources.
Visium FF vs. Other Spatial Transcriptomics Approaches
Understanding where Visium FF excels — and where complementary methods add value — is essential for experimental design.
From fresh frozen tissue block to publication-ready spatial expression atlas — our Visium FF pipeline covers every step with validated protocols and expert support.
Step 1 — Tissue QC & Cryosectioning: Fresh frozen OCT-embedded tissue blocks are evaluated for tissue integrity, morphological quality, and RNA quality (RIN assessment from adjacent tissue slices). Tissue is cryosectioned to 10 µm thickness under temperature-controlled conditions. Sections are placed directly on the Visium capture slide within the fiducial frame of each capture area — no CytAssist transfer step required for FF direct placement.
Step 2 — H&E Staining & Brightfield Imaging: Mounted sections are fixed, stained with Hematoxylin and Eosin (H&E), and imaged at high resolution (10× or 20× magnification) using a brightfield microscope before RNA capture. This image is used downstream by Space Ranger to align spatial barcodes to tissue morphology, enabling direct overlay of gene expression clusters onto the histological image. Immunofluorescence (IF) staining is available as an alternative to H&E for protein co-detection.
Step 3 — Permeabilization & Poly(A) mRNA Capture: The tissue section is permeabilized with a tissue-type-specific enzyme and time, releasing poly(A)-tailed mRNA from cells. Released RNA diffuses directly onto the underlying capture spots, where it hybridizes to spatially barcoded poly(dT) capture oligonucleotides. In situ reverse transcription incorporates the spatial barcode and molecular barcodes into first-strand cDNA anchored to the slide surface.
Step 4 — Library Preparation & Illumina Sequencing: Spatially indexed cDNA is denatured from the slide, amplified, and converted into an Illumina-compatible library. Libraries are sequenced on NovaSeq to a recommended depth of 25,000–50,000 reads per spot (approximately 125–250 million reads per capture area). Paired-end 28+90 bp sequencing reads the 16 nt spatial barcode + 12 nt molecular barcodes in Read 1 and the cDNA insert in Read 2.
Step 5 — Space Ranger Processing & Bioinformatics: Raw FASTQ files are processed through the 10x Space Ranger pipeline for barcode demultiplexing, read alignment, molecular barcodes counting, and spatial barcode registration to the H&E image. Downstream analysis uses Seurat or Squidpy for unsupervised clustering, spatially variable gene detection, and cell type deconvolution. Full deliverables are described in the Bioinformatics section below.
Get Your Instant Quote
Key Applications
Visium FF is the method of choice when spatial tissue architecture must be preserved alongside whole-transcriptome discovery — particularly in non-human species, complex tissues, and novel disease models.
1
Tumor Microenvironment & Cancer Spatial Biology
Visium FF resolves transcriptional heterogeneity within tumors at the spatial level — mapping gene expression differences between tumor core, invasive edge, and surrounding stroma in a single experiment. Ligand-receptor interaction analyses reveal paracrine signaling networks between tumor and immune cell populations in their native tissue context, advancing understanding of treatment resistance and immune evasion.
2
Brain & Neural Tissue Architecture
The brain's layered cytoarchitecture makes spatial context essential for interpreting gene expression data. Visium FF resolves cortical layer-specific expression patterns, hippocampal subfield transcriptomes, and cerebellar laminar organization with full-transcriptome coverage — supporting neuroscience research in mouse, rat, zebrafish, and human post-mortem brain tissue.
3
Developmental Biology & Tissue Atlases
Mapping spatial gene expression during embryonic and organ development reveals patterning gradients, signaling boundaries, and tissue compartment identities that are invisible in single-cell data from dissociated samples. Visium FF is compatible with diverse embryonic stages across species — enabling spatial atlas construction for developmental biology and comparative genomics projects.
4
Non-Model Organisms & Cross-Species Studies
Unlike FFPE probe-based Visium, which requires species-specific probe panels validated only for human and mouse, Visium FF's unbiased poly(A) capture works for any organism with a reference genome — making it the only Visium mode suitable for zebrafish, agricultural animals, insects, and non-model research organisms. For spatial transcriptome sequencing in non-standard species, Visium FF is the recommended starting point.
5
Spatial Multi-Omics Integration with scRNA-Seq
Visium FF data is routinely integrated with single-cell RNA sequencing datasets using computational deconvolution tools (SPOTlight, RCTD, cell2location) to achieve single-cell-resolution spatial mapping. Each Visium spot receives a predicted cellular composition from a matched scRNA-seq reference, transforming spatial expression data into a cell-type-resolved spatial atlas of the tissue.
Sample Requirements
Fresh frozen tissue quality is the single most important determinant of Visium FF data quality. Tissue should be collected and frozen rapidly to preserve RNA integrity and spatial RNA distribution. Please contact us before collection for tissue-type-specific OCT embedding protocols.
Sample Parameter
Specification
Notes
Sample format
OCT-embedded fresh frozen tissue block
Other cryoprotectants may interfere with capture; contact us for alternatives
Ship tissue blocks — do not pre-section before submission unless pre-agreed
Number of sections per project
Recommended ≥ 2 replicates per condition
Minimum 1 section per capture area; up to 4 sections per standard slide
Species
Any with a reference transcriptome
Human, mouse, rat, and zebrafish are 10x-validated; others feasible with reference genome
Permeabilization time: Must be empirically optimized per tissue type. We provide access to the 10x Genomics Tissue Optimization Kit and recommend a pre-experiment permeabilization test for tissues not on the 10x validated list.
Avoid FFPE blocks: FFPE samples require the CytAssist probe-based workflow — not Visium FF. If your samples are FFPE, please enquire about our separate FFPE Spatial Transcriptomics service.
Freezing method: Snap-freezing in liquid nitrogen or isopentane (cooled on dry ice) immediately after dissection is strongly preferred over slow freezing. Samples frozen with non-OCT methods may show tissue cracking or crystal formation that degrades section quality.
Bioinformatics Analysis & Deliverables
Our Visium FF bioinformatics pipeline delivers both standard Space Ranger outputs and advanced spatial analysis — all formatted for direct use in publication and downstream integration with scRNA-seq or epigenomic datasets such as single-cell ATAC-seq.
Raw Data & Space Ranger: FASTQ files; Space Ranger output matrix (filtered_feature_bc_matrix); cloupe file for Loupe Browser interactive exploration; tissue_positions_list.csv; H&E image with spot alignment.
QC Report: Per-section metrics — median genes per spot, median molecular barcodes per spot, fraction spots under tissue, sequencing saturation, mapping rate.
Unsupervised Spatial Clustering: UMAP and spatially overlaid cluster maps using Seurat (SCTransform normalization, graph-based clustering). Differentially expressed marker genes per spatial cluster.
Spatially Variable Gene Analysis: Identification of genes with statistically significant spatial expression patterns using SpatialDE or Seurat's spatially variable features. Ranked list with visualization heatmaps.
Cell Type Deconvolution (when scRNA-seq reference provided): Proportional cell type predictions per spot using RCTD or cell2location. Spatial maps of cell type distributions overlaid on H&E image.
Ligand-Receptor Interaction Analysis: CellChat or NicheNet-based inference of intercellular communication networks across spatial domains, identifying paracrine signaling between anatomically defined tissue regions.
Multi-sample integration, pseudotime trajectory analysis, and pathway enrichment spatial mapping are available as extended bioinformatics options. All visualization outputs are provided in both PDF publication-ready format and interactive Loupe Browser format.
References
Zur R, Tilsner-Kirchner A, Stassi DG, et al. Spatial transcriptomics reveals distinct and conserved tumor core and edge architectures that predict survival and targeted therapy response. Nat Commun. 2023;14:5069. https://doi.org/10.1038/s41467-023-40271-4
Rao A, Barkley D, França GS, Bhatt DL. Exploring tissue architecture using spatial transcriptomics. Nature. 2021;596(7871):211–220. https://doi.org/10.1038/s41586-021-03634-9
Kleshchevnikov V, Shmatko A, Dann E, et al. Cell2location maps fine-grained cell types in spatial transcriptomics. Nat Biotechnol. 2022;40(5):661–671. https://doi.org/10.1038/s41587-021-01139-4
For Research Use Only. Not for use in diagnostic or clinical procedures.
Demo Results
Unsupervised spatial clustering overlaid on H&E image — distinct transcriptionally defined tissue domains including tumor core, invasive margin, and stromal compartments are resolved in their native anatomical context. Clusters correspond to histologically identified regions confirmed by pathologist review. (Zur R et al., Nat Commun, 2023)
Cell type deconvolution map — RCTD-based proportional assignment of tumor cells, CD8+ T cells, macrophages, cancer-associated fibroblasts, and endothelial cells to each Visium spot using a matched scRNA-seq reference atlas. Each spot color encodes the dominant cell type at that spatial coordinate.
10x Visium FF Spatial Transcriptomics FAQs
1. What is the difference between Visium FF and Visium FFPE — which should I choose?
Visium FF uses direct placement of fresh frozen sections onto the capture slide, where poly(A)-tailed mRNA is captured by poly(dT) oligonucleotides — providing unbiased whole-transcriptome coverage for any species with a reference genome. Visium FFPE (via CytAssist) uses a probe hybridization approach where pre-designed probes targeting ~18,000 human or mouse genes are hybridized to the tissue and then transferred to the capture slide; this enables use of archived FFPE samples but is limited to species and panel designs validated by 10x Genomics. Choose Visium FF when working with non-human species, when unbiased discovery is the priority, or when high-quality fresh frozen tissue is available. Choose Visium FFPE when only archival FFPE material is available or when working in human/mouse with a validated probe set.
2. How many cells does each Visium spot capture — is it single-cell resolution?
Standard Visium spots are 55 µm in diameter with 100 µm center-to-center spacing, capturing RNA from a region containing an average of 1 to 10 cells depending on tissue type and cell density. This is not true single-cell resolution — it is multicellular spot-level resolution. To achieve single-cell spatial resolution, computational deconvolution using a matched scRNA-seq reference (RCTD, cell2location, SPOTlight) can decompose each spot's expression profile into contributing cell type proportions. True single-cell spatial resolution requires in situ technologies such as 10x Xenium or Vizgen MERSCOPE, which are available through our broader spatial omics portfolio.
3. What sequencing depth is recommended for Visium FF?
10x Genomics recommends 25,000 to 50,000 reads per tissue-covered spot. For a typical tissue with ~80% spot coverage across a standard 6.5 × 6.5 mm capture area (~4,000 covered spots), this translates to approximately 100–200 million reads per section. For discovery experiments in less-characterized organisms or rare transcripts, 50,000 reads per spot is preferred. Our project design consultation includes sequencing depth recommendation based on your tissue type and scientific objectives.
4. Can Visium FF be used for non-human species?
Yes — Visium FF's unbiased poly(A) capture mechanism works for any organism that produces polyadenylated mRNA, provided a reference genome and transcriptome annotation are available for alignment. 10x Genomics has validated optimized permeabilization conditions for human, mouse, rat, and zebrafish tissues. For other species, permeabilization time optimization using the Tissue Optimization Kit is required. N2 Jenomics Lab Pvt. Ltd. has applied Visium FF to a range of agricultural, aquatic, and invertebrate species — contact our team to discuss your organism's specific requirements.
5. How should fresh frozen tissue be prepared and shipped to your lab?
Tissue should be dissected and snap-frozen in OCT compound using isopentane pre-cooled on dry ice or liquid nitrogen as rapidly as possible after collection — ideally within minutes. Blocks should be stored at –80°C and shipped on dry ice. Do not pre-section blocks before shipping unless specifically pre-agreed with our team, as sections are damaged by repeated freeze-thaw cycles. We provide a tissue collection and OCT embedding SOP upon project initiation; following it precisely is the single most important step in Visium FF project success.
10x Visium FF Spatial Transcriptomics Case Studies
Published Research Highlight
Spatial Transcriptomics Reveals Distinct and Conserved Tumor Core and Edge Architectures That Predict Survival and Targeted Therapy Response
Oral squamous cell carcinoma (OSCC) is known to harbor transcriptionally distinct tumor cell populations at the tumor core versus the leading edge — but the molecular identity of these populations, their associated immune and stromal components, and their clinical significance had not been systematically characterized at spatial resolution. Zur et al. employed Visium FF spatial transcriptomics to resolve the gene expression landscape of OSCC tumor microenvironments and to identify spatially defined transcriptional architectures with prognostic and therapeutic relevance.
Materials & Methods
Sample Preparation
12 fresh-frozen surgically resected OSCC samples from 10 patients
OCT-embedded tissue blocks cryosectioned to Visium slides
H&E staining and pathologist annotation of morphological regions
Space Ranger alignment and molecular barcodes quantification
Batch-corrected dimensionality reduction and clustering (Seurat)
Cellular deconvolution with scRNA-seq reference integration
Ligand-receptor interaction analysis per spatial domain
Results
Spatially Distinct Tumor Core and Edge Transcriptional Programs
Unsupervised clustering of 24,876 spots identified transcriptionally distinct domains corresponding to tumor core, leading edge, stroma, and immune-enriched regions — validated by pathologist morphological annotation (Fig. 1).
The leading edge was characterized by epithelial-mesenchymal transition (EMT) signatures, while the core showed proliferative and metabolic programs — spatially resolved at a level impossible with bulk or single-cell approaches.
The relative abundance of leading-edge versus core transcriptional programs was conserved across patients and correlated significantly with overall survival — establishing spatial expression architecture as a prognostic biomarker.
Ligand-receptor analysis identified spatial communication networks between tumor edge cells and infiltrating immune populations, pointing to targetable paracrine signaling axes.
Fig. 1 — Overview of experimental design for Visium FF spatial transcriptomics of OSCC patient samples: H&E-stained tissue sections with pathologist-annotated morphological regions, UMAP of 24,876 spatially profiled spots, and spatial cluster maps overlaid on tumor tissue. (Zur R et al., Nat Commun, 2023)
Conclusion
This study demonstrates the power of Visium FF spatial transcriptomics to decode intratumoral heterogeneity at its native spatial scale — revealing that the gene expression architecture of tumor core versus edge carries prognostic information that bulk RNA-seq and scRNA-seq cannot capture. The approach directly exemplifies what N2 Jenomics Lab Pvt. Ltd. ' Visium FF service delivers: whole-transcriptome spatial maps from fresh frozen tumor tissue, with cell type deconvolution, ligand-receptor analysis, and direct correlation to pathological morphology.
Reference
Zur R, Tilsner-Kirchner A, Stassi DG, et al. Spatial transcriptomics reveals distinct and conserved tumor core and edge architectures that predict survival and targeted therapy response. Nat Commun. 2023;14:5069. https://doi.org/10.1038/s41467-023-40271-4
Address:Registered Office: 150, Patparganj Industrial Area, New Delhi – 110092, India
Operational Address:National Institute of Plant Genome Research (BRIC - NGGF)
Lab No. 206 and 207, Aruna Asaf Ali Marg, P.O. Box No. 10531,
New Delhi – 110067, India