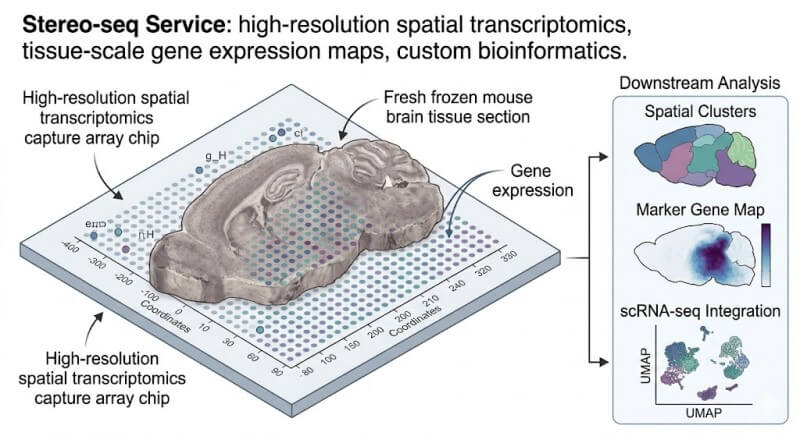
Stereo-seq Service from N2 Jenomics Lab Pvt. Ltd. helps researchers map transcriptome-wide gene expression across tissue sections while preserving spatial location. We support tissue review, spatial capture planning, sequencing, spatial clustering, marker gene mapping, scRNA-seq integration, and custom bioinformatics so your team can connect molecular data with tissue architecture.
Stereo-seq Spatial Transcriptomics for High-Resolution Tissue Mapping
Stereo-seq is a spatial transcriptomics approach used to map gene expression across tissue sections while keeping spatial location information. Instead of dissociating tissue and losing its original architecture, Stereo-seq allows researchers to study where transcripts are detected, how expression patterns change across tissue regions, and how molecular signals relate to morphology.
This service is a strong fit when location is central to your question. Your project may need to compare tumor regions, map developmental structures, study brain architecture, examine immune tissue organization, build organ atlases, or place scRNA-seq-defined cell states back into tissue space. In these studies, spatial context is not just an added layer. It is often the key to interpreting the biology.
What Stereo-seq Can Help Reveal
Which genes show region-specific expression across a tissue section?
How are spatial clusters or tissue domains organized?
Which marker genes define different spatial regions?
How do tissue architecture and gene expression patterns align?
Where are inferred cell populations distributed across the tissue?
How do spatial regions differ between groups, conditions, or developmental stages?
Can scRNA-seq cell states be mapped back into tissue context?
When Researchers Use Stereo-seq
Researchers often come to us when standard RNA sequencing, scRNA-seq, or imaging alone cannot answer a spatial question. Common use cases include tumor microenvironment research, developmental biology, embryo mapping, brain and neuroscience studies, organ atlas construction, immune microenvironment studies, plant tissue mapping, model organism research, and spatial multi-omics planning.
Why Spatial Context Matters Beyond scRNA-seq and Histology
Many tissue biology questions cannot be answered by expression values alone. Location matters. A gene expression pattern may look clear in a matrix, but its meaning often depends on where it appears in the tissue, which region it belongs to, and which neighboring structures surround it.
scRNA-seq Loses Tissue Organization
Single-cell RNA sequencing is powerful for identifying cell states and transcriptional programs. However, tissue dissociation removes the original spatial relationships among cells. Stereo-seq can complement scRNA-seq by adding spatial location back to the analysis.
Histology and IHC Are Marker-Limited
Histology and marker-based staining provide valuable tissue morphology information, but they usually do not provide transcriptome-wide expression information across the full tissue section.
Stereo-seq Bridges Gene Expression and Tissue Architecture
Stereo-seq generates spatially indexed expression data, helping your team review spatial expression maps, tissue domains, marker genes, and integrated visualizations.
How Stereo-seq Works: From Tissue Review to Spatial Expression Maps
A successful Stereo-seq project starts before the tissue section enters the spatial workflow. Tissue quality, preservation, section orientation, morphology, RNA quality, and research goals all affect the final data. We review these details with you before project setup so the workflow fits your biological question.
1. Project Design and Tissue Review
We begin by reviewing your tissue type, species, preservation method, region of interest, biological groups, and analysis goals. We also discuss whether your project needs spatial clustering, marker gene mapping, scRNA-seq integration, multi-sample comparison, or custom visualization.
QC checkpoint: tissue type, preservation method, project groups, region of interest, spatial resolution goal, and analysis plan.
2. Tissue Preparation and Section Quality Review
Stereo-seq depends strongly on tissue section quality. Fresh frozen or OCT-embedded samples may be suitable, depending on tissue type and project design. Tissue morphology, freezing quality, section integrity, RNA preservation, and region orientation should be reviewed before the project proceeds.
QC checkpoint: tissue integrity, freezing quality, morphology, RNA preservation risk, section orientation, and region suitability.
3. Tissue Imaging and Spatial Capture
The tissue section is imaged and then processed for spatial transcript capture. The spatial capture array links captured transcripts to coordinates, allowing gene expression to be mapped back to tissue position.
QC checkpoint: tissue coverage, imaging quality, spatial capture area, tissue-to-array alignment, and region visibility.
4. Library Preparation and Sequencing
After spatial capture, captured transcripts are converted into sequencing libraries. Sequencing generates reads that are processed into a spatial expression matrix. Each expression value is linked to a coordinate, making it possible to visualize gene expression across the tissue section.
After sequencing, we process the data to generate spatial expression outputs. We review read quality, mapping performance, gene detection, tissue coverage, coordinate consistency, and image alignment.
We analyze spatial clusters, tissue domains, marker genes, region-level expression patterns, and optional scRNA-seq integration. At delivery, you receive raw and processed data, QC summaries, spatial maps, tables, figures, and a project report.
Stereo-seq vs scRNA-seq, Visium HD, Visium FF, Xenium, and Histology
Different tissue-based questions need different methods. Stereo-seq is strong when the goal is high-resolution spatial gene expression mapping across tissue sections, but it is not the only spatial option. We help you select the approach that best fits your sample type, tissue condition, resolution needs, and downstream analysis goals.
In situ gene maps and segmented cell-level outputs
Cell clusters and gene expression profiles
Tissue images and marker staining patterns
Best-fit question
Where are gene expression programs located across tissue regions?
How can I run high-resolution spatial profiling in a 10x workflow?
How can I study archived FFPE tissues spatially?
Where are selected transcripts located at high resolution?
What cell states are present in a tissue sample?
What does the tissue look like and where are selected markers found?
scRNA-seq integration
Useful for reference-informed annotation
Useful
Useful
Useful for targeted interpretation
Can serve as reference
Not transcriptome-wide
Key limitation
Tissue quality and data interpretation require careful planning
Platform and sample constraints should be reviewed
FFPE RNA quality and assay design matter
Targeted panel limits discovery breadth
Spatial organization is removed
Molecular breadth is limited
Best-fit user
Tissue atlas, tumor heterogeneity, developmental, brain, immune, and organ mapping projects
Researchers preferring a 10x high-resolution spatial workflow
Researchers working with FFPE tissue material
Researchers focused on targeted in situ marker panels
Researchers building cell-state references
Researchers needing morphology or selected marker confirmation
How We Help You Select the Right Spatial Strategy
Choose Stereo-seq when you need high-resolution tissue-scale spatial gene expression mapping and broad transcriptomic discovery across tissue regions.
Choose 10x Visium HD Spatial Transcriptomics Service when you prefer a 10x high-resolution spatial workflow.
Choose 10x Visium FF Spatial Transcriptomics Service when FFPE tissue compatibility is a primary project requirement.
Choose 10x Xenium In Situ Service when targeted in situ gene panels and cell segmentation are more important than broad discovery.
Choose Spatial Multi-Omics Sequencing Services when transcriptomics should be combined with additional spatial or omics layers.
Bioinformatics Analysis and Deliverables
Stereo-seq projects generate complex spatial data. We process these data into clear outputs so your team can review expression patterns, spatial structure, gene markers, and integrated annotations.
Standard Spatial Transcriptomics Analysis
Raw sequencing data QC
Spatial barcode processing
Spatial expression matrix generation
Image and coordinate alignment
Tissue coverage review
Detected gene and read distribution assessment
Spatial clustering
Spatial domain detection
Marker gene analysis
Region-level expression comparison
Spatial gene expression visualization
Integrated Spatial Analysis
For projects with additional data or custom questions, we can extend the analysis with scRNA-seq reference integration, inferred cell-type distribution, spatial niche or neighborhood analysis, multi-sample comparison, group-level region comparison, pathway or GO enrichment, tumor-stroma-immune region comparison, custom tissue annotation, and custom spatial visualization.
Deliverable
What It Shows
Why It Matters
Raw sequencing data
Original sequencing output
Supports data storage and downstream reanalysis
Spatial expression matrix
Gene counts linked to spatial coordinates
Core data for spatial transcriptomics analysis
Tissue image
Morphology and section context
Helps connect gene expression with tissue architecture
Spatial coordinate file
Location information for expression values
Enables spatial mapping and visualization
QC summary
Read quality, mapping, detected genes, tissue coverage, and processing metrics
Helps evaluate data quality
Spatial cluster map
Tissue regions grouped by expression similarity
Reveals spatial organization
Spatial domain results
Region-level expression patterns
Supports biological interpretation of tissue structure
Marker gene table
Genes enriched in clusters or regions
Helps define molecular features of tissue regions
scRNA-seq integration outputs
Reference-informed cell-type or cell-state distribution
Connects single-cell information to tissue space
Final report
Methods, QC, figures, tables, and interpretation notes
Provides a structured project summary
Sample Requirements for Stereo-seq
Sample requirements depend on tissue type, preservation method, section format, tissue morphology, RNA quality, and the selected spatial workflow. We confirm the final plan before sample submission because tissue section needs can vary by project.
The table below keeps Stereo-seq-specific section values in project review status. General RNA integrity expectations are included only as practical reference points for transcriptomics projects, while tissue section dimensions, slide format, section thickness, and capture area should be confirmed before submission.
Sample Type
Preservation
Recommended Format
Section Requirements
Tissue / RNA Quality
Imaging / Morphology Notes
Shipping
Best-Fit Workflow
Notes
Fresh frozen tissue
Fresh frozen
Tissue block or prepared section
Confirm before submission
Preserve RNA quality; general transcriptomics reference: RIN ≥7
Region of interest and tissue orientation should be clear
Dry ice
Stereo-seq
Avoid repeated freeze-thaw cycles
OCT-embedded tissue
OCT-embedded frozen tissue
Block or section
Confirm before submission
Confirm before submission
OCT quality and section morphology should be reviewed
Dry ice
Stereo-seq
Suitable format depends on tissue and section plan
Tumor tissue
Fresh frozen or OCT-embedded
Tissue block or section
Confirm before submission
Necrosis and low-quality regions should be reviewed
Tumor, stromal, immune, and boundary regions may require careful selection
Dry ice
Stereo-seq or integrated spatial analysis
Region annotation improves interpretation
Brain tissue
Fresh frozen or OCT-embedded
Tissue block or section
Confirm before submission
Confirm before submission
Anatomical orientation is important
Dry ice
Stereo-seq
Useful for region and layer mapping
Embryo or organ tissue
Fresh frozen or OCT-embedded
Whole section or selected region
Confirm before submission
Confirm before submission
Developmental stage and orientation should be documented
Dry ice
Stereo-seq
Metadata are important for stage comparison
Plant tissue
Fresh frozen or optimized preparation
Tissue block or section
Confirm before submission
Confirm before submission
Autofluorescence, cell wall structure, and tissue handling should be reviewed
Confirm before submission
Stereo-seq with custom review
Reference support may affect analysis depth
Customer-supplied spatial data
Data files
Expression matrix, coordinates, images, and metadata
Not applicable
Not applicable
Image and coordinate files should be complete
Secure data transfer
Custom reanalysis
Reference files and group metadata are required
If you are unsure whether your sample is suitable, contact us before collection or sectioning. Early review helps reduce avoidable sample risk and makes the downstream analysis plan clearer.
Discuss Your Project
Applications of Stereo-seq in Spatial Biology
Stereo-seq supports tissue biology studies where gene expression needs to be interpreted with spatial location, tissue structure, and region-level context.
1
Tumor Microenvironment and Tissue Heterogeneity
Stereo-seq can help researchers map region-specific expression across tumor tissue, stromal areas, immune-rich regions, invasive boundaries, and tissue niches.
2
Developmental Biology and Embryo Mapping
Developmental studies often require spatial context because gene expression changes across anatomical regions and developmental structures.
3
Brain, Neuroscience, and Organ Atlas Research
Brain and organ atlas projects benefit from spatial gene expression maps that preserve tissue architecture.
4
Immunology and Inflammatory Tissue Research
Stereo-seq can help examine immune-enriched regions, inflammatory niches, tissue boundaries, and region-level gene expression patterns.
5
Plant and Model-Organism Spatial Biology
Stereo-seq can support spatial mapping of tissue layers, developmental structures, and region-specific gene expression when sample preparation and annotation resources are suitable.
Why Choose N2 Jenomics Lab Pvt. Ltd. for Stereo-seq
We support Stereo-seq as a complete spatial transcriptomics workflow, not just a sequencing run. Our team helps you think through tissue suitability, workflow selection, spatial data quality, bioinformatics strategy, and final deliverables.
End-to-End Spatial Transcriptomics Support: We support tissue review, section planning, spatial capture workflow support, sequencing, QC, spatial clustering, spatial domain analysis, marker gene mapping, and report delivery.
Custom Spatial Bioinformatics: We help process spatial expression matrices, align coordinates, detect spatial clusters, map marker genes, compare tissue regions, and integrate scRNA-seq references where appropriate.
Integration with Spatial Multi-Omics and Single-Cell Data: We can help connect Stereo-seq results with single-cell references, spatial multi-omics strategies, or related spatial platforms.
Clear Deliverables for Research Teams: We organize outputs into raw data, processed matrices, QC summaries, spatial maps, marker tables, integrated visualizations, and final analysis reports.
Demo Results: What Stereo-seq Data Can Look Like
Stereo-seq data can be delivered as spatial maps, expression matrices, cluster results, marker gene tables, and integrated visual reports. The exact outputs depend on sample quality, tissue type, project design, and analysis goals.
Spatial Gene Expression and Tissue Region Map
A spatial gene expression view shows where selected genes are detected across the tissue section. In a typical report, this may include a tissue image paired with expression overlays, helping your team see whether marker genes localize to specific tissue regions, layers, boundaries, or niches.
Spatial gene expression maps
Region-specific marker visualization
Tissue image overlay
Coordinate-based expression views
Region-level expression comparison
Spatial Clustering and Marker Gene Heatmap
Spatial clustering groups tissue locations with similar expression patterns. Marker gene analysis then helps define the molecular features of each spatial cluster or tissue domain.
Spatial cluster map
Spatial domain annotation
Marker gene table
Marker gene heatmap
Cluster-level expression comparison
scRNA-seq Integration and Inferred Cell-Type Distribution
When a suitable scRNA-seq reference is available, spatial data can be integrated with single-cell profiles to infer where cell types or cell states are enriched.
Reference-informed cell-type distribution map
Cell-state enrichment by tissue region
Spatial niche or neighborhood view
Integrated UMAP-to-space interpretation
Multi-sample distribution comparison
Frequently Asked Questions About Stereo-seq Service
1. What is Stereo-seq?
Stereo-seq is a spatial transcriptomics approach used to map gene expression across tissue sections while preserving spatial coordinates. It helps researchers study where genes are expressed and how expression patterns relate to tissue structure.
2. How is Stereo-seq different from scRNA-seq?
scRNA-seq profiles dissociated cells and is useful for identifying cell states, but it removes tissue location. Stereo-seq preserves spatial information, allowing gene expression to be mapped across tissue regions.
3. How is Stereo-seq different from 10x Visium HD?
Stereo-seq and 10x Visium HD are both spatial transcriptomics approaches, but they differ in platform design, workflow, and project fit. N2 Jenomics Lab Pvt. Ltd. can help you choose between Stereo-seq and 10x Visium HD Spatial Transcriptomics Service based on tissue type, resolution goals, and analysis needs.
4. How is Stereo-seq different from Xenium?
Stereo-seq is used for spatial transcriptomics discovery across tissue sections. 10x Xenium In Situ Service is more suitable when the project focuses on targeted in situ gene panels and cell segmentation. The best choice depends on whether you need broad discovery or targeted in situ mapping.
5. What tissue samples are suitable for Stereo-seq?
Fresh frozen tissue, OCT-embedded tissue, tumor tissue, brain tissue, embryo or organ tissue, plant tissue, and model-organism tissue may be considered. Final suitability depends on tissue quality, preservation method, section format, and project goals.
6. Can Stereo-seq be integrated with scRNA-seq data?
Yes. When a suitable scRNA-seq reference is available, Stereo-seq data can be integrated with single-cell profiles to support reference-informed cell-type or cell-state mapping in tissue space.
7. What deliverables are included?
Typical deliverables include raw sequencing data, spatial expression matrices, tissue images, coordinate files, QC summaries, spatial cluster maps, marker gene tables, gene expression maps, integrated analysis outputs, and a final report.
8. Can Stereo-seq identify cell types?
Stereo-seq can support reference-informed cell-type or cell-state annotation when suitable reference data are available. These annotations should be interpreted with reference quality, tissue context, and marker evidence in mind.
9. What are the main limitations of spatial transcriptomics interpretation?
Major limitations include tissue quality, section preparation, RNA preservation, spatial resolution fit, reference availability, data complexity, and uncertainty in cell-type annotation when reference datasets are incomplete.
Yes. We can review customer-supplied spatial transcriptomics data when expression matrices, coordinates, tissue images, metadata, and reference files are available.
Case Study: Stereo-seq for Mouse Organogenesis Spatial Atlas Construction
Background
Mouse organogenesis is a highly spatial process. During development, tissues form through coordinated changes in gene expression, cell-state distribution, anatomical structure, and regional organization. Standard transcriptome profiling can measure gene expression, but it does not preserve where those expression programs occur in the embryo. A spatial transcriptomics approach is therefore valuable for building developmental atlases that connect molecular patterns with anatomical structures.
The study Spatiotemporal transcriptomic atlas of mouse organogenesis using DNA nanoball-patterned arrays used DNA nanoball-patterned arrays to build a spatiotemporal transcriptomic atlas of mouse organogenesis. This paper is a strong public literature example for Stereo-seq because it directly demonstrates tissue-scale spatial gene expression mapping in a developmental system.
Methods
The study used a DNA nanoball-patterned array strategy to capture transcriptomic information with spatial coordinates. Mouse embryo sections were processed so gene expression could be assigned back to spatial locations across developing tissues. The workflow connected spatial capture, sequencing, image-based tissue context, gene expression mapping, and computational analysis.
Figure 1 of the paper presents the study design and technology overview. It illustrates how spatially indexed transcriptomic information can be generated from tissue sections and used to build spatial maps across mouse organogenesis.
Results
The study generated spatial transcriptomic maps that retained tissue-scale location information across mouse organogenesis. These maps showed that gene expression patterns could be connected to anatomical structures and developmental regions rather than analyzed as a location-free expression matrix.
Region-specific expression patterns could be assigned to developing structures.
Spatially resolved data supported atlas-level interpretation across organogenesis.
The DNA nanoball-patterned array strategy enabled large-area spatial transcriptomic mapping with high spatial detail.
Figure 1 shows the overall Stereo-seq study design and spatial atlas workflow, linking tissue structure with transcriptome-wide expression.
Figure 1 from Spatiotemporal transcriptomic atlas of mouse organogenesis using DNA nanoball-patterned arrays shows the Stereo-seq study design and spatial atlas workflow connecting tissue structure with transcriptome-wide expression.
Conclusion
This study shows how Stereo-seq can support high-resolution spatial transcriptomics for large developmental tissue systems. For researchers planning tissue atlas, developmental biology, organ mapping, or region-specific expression studies, the key value is not only data generation. The value comes from connecting tissue preparation, spatial capture, sequencing, coordinate-aware analysis, and interpretable visual outputs into one project workflow.
Address:Registered Office: 150, Patparganj Industrial Area, New Delhi – 110092, India
Operational Address:National Institute of Plant Genome Research (BRIC - NGGF)
Lab No. 206 and 207, Aruna Asaf Ali Marg, P.O. Box No. 10531,
New Delhi – 110067, India