QTL-seq Approach | High-Resolution QTL Mapping for Crop Research
QTL-seq is a sequencing-based bulked segregant analysis (BSA) method for mapping quantitative trait loci (QTLs) with speed and accuracy. Unlike traditional QTL mapping, which requires extensive genotyping, QTL-seq leverages high-throughput resequencing of pooled samples to identify trait-linked regions quickly.
At N2 Jenomics Lab Pvt. Ltd. , we deliver an end-to-end QTL-seq pipeline, from experimental design and sequencing to variant calling and candidate gene discovery. Our services help biochemistry labs, CRO clients, and academic researchers accelerate crop improvement, functional genomics, and trait dissection studies.
Service Highlights
Fast and cost-effective identification of trait-associated regions
Optimized for rice, maize, wheat, and other crops
Flexible population options: F2, RILs, DH lines
Publication-ready data with expert bioinformatics support
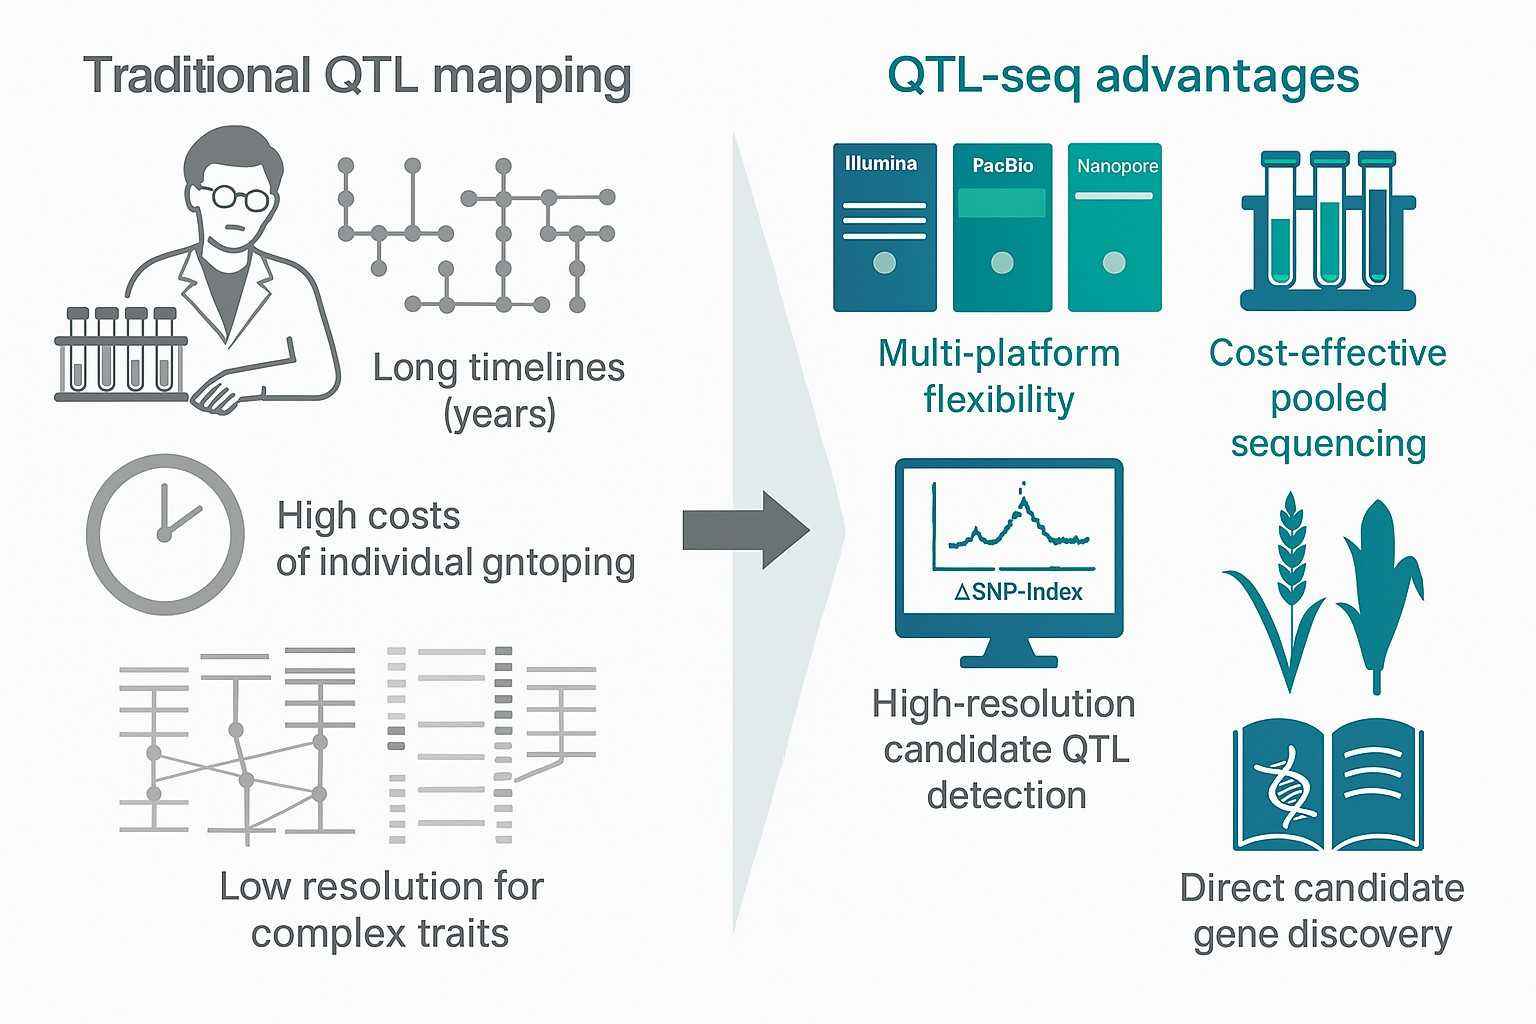
QTL-seq is a next-generation sequencing method based on bulked segregant analysis (BSA). It rapidly identifies genomic regions, known as quantitative trait loci (QTLs), that are associated with important agricultural or biological traits. Unlike traditional linkage mapping, which requires years of individual marker genotyping, QTL-seq uses pooled sequencing of extreme phenotypes to speed up discovery.
In a typical QTL-seq approach, researchers cross two contrasting parents, develop a mapping population, and then pool individuals showing extreme phenotypes (for example, disease-resistant vs susceptible rice lines). Sequencing these bulks and comparing allele frequency differences across the genome allows the detection of candidate QTLs linked to the trait of interest.
This approach has become widely adopted in plant breeding and functional genomics because it combines speed, cost-effectiveness, and high-resolution mapping. By focusing directly on DNA variation between bulks, QTL-seq enables researchers to localize key trait-associated genes in weeks rather than years.
Why Choose the QTL-seq Approach?
Speed: Identify QTLs within weeks instead of years by sequencing bulks rather than entire populations.
Cost-effectiveness: Pooling reduces the number of DNA extractions and sequencing libraries, lowering experimental costs.
Resolution: High-density sequence data detects trait-associated regions with greater precision than conventional methods.
Flexibility: Applicable to a wide range of populations, including F2, recombinant inbred lines (RILs), and doubled haploids (DH).
Cross-species use: Validated in rice, maize, wheat, rapeseed, and many other crops.
QTL-seq is particularly valuable when researchers need to locate major-effect genes that control agronomic traits such as disease resistance, plant height, yield, or stress tolerance. By shortening the path from population development to candidate gene discovery, it enables faster decision-making in crop breeding and functional genomics.
QTL-seq Pipeline Overview
N2 Jenomics Lab Pvt. Ltd. provides a complete QTL-seq pipeline that covers every step from study design to candidate gene discovery. Our workflow ensures reproducibility, cost efficiency, and high-quality outputs suitable for publication.
QTL-seq Workflow Steps
Parental Selection and Population Design
Choose contrasting parents (e.g., resistant vs susceptible).
Develop appropriate mapping populations such as F2, RILs, or DH lines.
Extreme Phenotype Pooling
Select 20–50 individuals showing the highest and lowest trait values.
Pool DNA from each group to create "High" and "Low" bulks.
Sequencing
Perform high-throughput resequencing using Illumina, PacBio, or Nanopore platforms.
Achieve sufficient depth to detect reliable variants.
Variant Calling
Align reads to the reference genome.
Detect SNPs and Indels using validated bioinformatics pipelines.
SNP-index and ΔSNP-index Calculation
Calculate allele frequency (SNP-index) for each bulk.
Derive ΔSNP-index by comparing bulks to identify candidate trait regions.
Candidate QTL Region Detection
Visualize ΔSNP-index across the genome.
Apply statistical thresholds and permutation tests to confirm significance.
Annotation and Candidate Gene Discovery
Annotate variants within QTL intervals.
Identify functional mutations and perform GO/KEGG pathway enrichment.
Key Outcomes
Rapid detection of trait-associated QTLs
High-resolution plots for publication
Annotated candidate gene lists for downstream validation
Bioinformatics Analysis
Our bioinformatics team applies validated pipelines to ensure accurate and reproducible QTL-seq results. Each stage of analysis is performed under strict quality control to deliver high-confidence outputs suitable for publication and downstream research.
Analysis Step
Description
Tools / Methods
Deliverables
Data Quality Control
Filter low-quality reads, remove adapters, check GC content and duplication.
FastQC, Trimmomatic
Clean FASTQ files, QC report
Read Alignment
Map clean reads to the reference genome with high accuracy.
BWA-MEM, Bowtie2
BAM alignment files
Variant Calling
Detect SNPs and Indels across pooled bulks.
GATK, SAMtools, FreeBayes
Raw VCF file with all variants
Variant Filtering
Apply depth, quality, and frequency thresholds to remove unreliable calls.
Define significant genomic regions associated with traits.
QTL IciMapping, custom R scripts
Candidate QTL intervals
Functional Annotation
Annotate variants within QTL intervals, identify candidate genes.
ANNOVAR, Ensembl VEP
Candidate gene list with variant annotations
Pathway & Enrichment Analysis
Explore biological functions of candidate genes (GO/KEGG).
clusterProfiler, KEGG Mapper
Functional enrichment plots and tables
Sample Requirements
Sample Type
Requirement
Notes
Parental Lines
Two parents with contrasting phenotypes (e.g., resistant vs susceptible).
Preferably sequenced; ensures higher accuracy in variant detection.
Mapping Population
F2, RILs, or DH populations.
Population size: ≥200 individuals recommended.
Bulk Construction
20–50 individuals per extreme pool.
Select based on highest and lowest trait values. For QTG-seq: ≥1000.
DNA Quantity
≥2 µg per bulk. Concentration ≥50 ng/µL.
Provide sufficient DNA for resequencing libraries.
DNA Purity
OD260/280 = 1.8–2.0; OD260/230 ≥2.0.
Free from RNA contamination and inhibitors.
DNA Integrity
Clear high molecular weight band on agarose gel.
No visible degradation or smearing.
Phenotypic Data (Optional)
Trait measurements for all mapping individuals.
Increases statistical power for QTL detection and validation.
Deliverables
Clients receive a comprehensive results package designed for downstream research and publication.
Clean sequencing data (FASTQ files with QC report)
Variant files (VCF with SNPs and Indels)
SNP-index and ΔSNP-index plots
Candidate QTL regions with significance statistics
Annotated candidate gene lists
GO/KEGG enrichment results
Publication-ready analysis report
Demo Results
SNP-index Plot
ΔSNP-index Plot with Thresholds
Candidate Gene Functional Enrichment
QTL-seq FAQs
Q: What is the difference between QTL-seq and traditional QTL mapping?
A: QTL-seq replaces much of individual genotyping with pooled sequencing of extreme phenotypes, dramatically reducing cost and effort. It uses allele frequency (SNP-index and ΔSNP-index) across bulks for trait linkage instead of scanning many individual markers as in traditional linkage mapping.
Q: How many samples are needed for each bulk in QTL-seq?
A: You need at least dozens of individuals per extreme bulk (e.g., high vs low phenotypes) to get reliable allele frequency estimates; more will improve statistical power. Bulk size depends on trait heritability, population type, and sequencing depth.
Q: Do I need to sequence both parents in QTL-seq?
A: Yes, sequencing both parental lines improves accuracy by helping to filter out background variation. It allows better identification of polymorphic markers and clearer ΔSNP-index signal.
Q: What depth of sequencing is required?
A: Depth should be sufficient to ensure reliable allele frequency estimates—moderate to high coverage in bulks is essential. Too shallow depth will increase noise and reduce ability to call true QTL regions. (Exact depth depends on organism and genome size.)
Q: Can QTL-seq be used for any crop species?
A: Yes, QTL-seq works for many crops including rice, wheat, maize, rapeseed, and others—as long as there is a reference genome and sufficient polymorphism between parents.
Q: How is false discovery or statistical significance handled in QTL-seq?
A: Statistical thresholds (e.g. 95% / 99% confidence intervals) and permutation tests are used. Sliding window smoothing of ΔSNP-index helps reduce noise. Filtering of low-quality variants and depths also essential.
QTL-seq Case Studies
Citation: Reddappa, S.B., Aski, M.S., Mishra, G.P. et al. QTL mapping for yield contributing traits in mungbean (Vigna radiata L.) using a RIL population. Scientific Reports 15, 20795 (2025). https://doi.org/10.1038/s41598-025-99687-1
1. Background
Mungbean (Vigna radiata L.) is a short-duration pulse crop important for food security across Asia. Despite its nutritional value and economic role, mungbean productivity remains low due to complex yield traits influenced by multiple genes and environment. Understanding the genetic basis of yield-related traits such as plant height, pod number, seed weight, and grain yield is critical for marker-assisted selection and breeding of improved varieties.
2. Methods
Population: A recombinant inbred line (RIL) population (166 lines, F9:10) derived from a cross between high-yielding Pusa Baisakhi and low-yielding line PMR-1.
Phenotyping: Six yield-contributing traits measured across multiple seasons (2022–2023).
Genotyping: Genotyping-by-sequencing (GBS) produced 38,931 SNPs; 1,374 high-quality SNPs used to construct a linkage map.
QTL Mapping: Composite interval mapping (CIM) and multiple interval mapping (MIM) were applied to detect significant QTLs (LOD > 3.0). Candidate genes were identified through whole-genome resequencing of parents and functional annotation.
3. Results
QTL Discovery: 17 QTLs were identified across nine chromosomes, explaining 9–24% phenotypic variance.
Key QTLs:
qPH-11-1: Plant height (21.5% PVE).
qSW-10-1: Seed weight (24.4% PVE).
qGY-7-1: Grain yield (11% PVE).
Candidate Genes: Included LOC106777318 (inositol-tetrakisphosphate 1-kinase, PH), LOC106775680 (ferredoxin-like, SW), and LOC106768860 (SPL transcription factor, GY).
Chromosome Hotspot: Chromosome 7 harbored five major QTLs for multiple traits, highlighting its significance in mungbean yield improvement.
Figure. Composite interval mapping of yield-related traits in mungbean, showing LOD score peaks for plant height, SPAD, seed weight, pod number, and grain yield.
4. Conclusions
This study demonstrates that high-density SNP-based QTL mapping can effectively dissect the genetic architecture of yield in mungbean. Grain yield was positively associated with pod number, leaf number, and chlorophyll content. Two QTLs with high PVE (qPH-11-1 and qSW-10-1) are prime targets for marker-assisted selection. Chromosome 7 emerged as a key region controlling multiple yield traits, making it a hotspot for breeding. The findings provide molecular markers and candidate genes that can accelerate mungbean improvement programs.
References:
Takagi H, Abe A, Yoshida K, Kosugi S, Natsume S, Mitsuoka C, Uemura A, Utsushi H, Tamiru M, Takuno S, Innan H, Cano LM, Kamoun S, Terauchi R. QTL-seq: rapid mapping of quantitative trait loci in rice by whole genome resequencing of DNA from two bulked populations. Plant J. 2013 Apr;74(1):174-83. doi: 10.1111/tpj.12105. Epub 2013 Feb 18. PMID: 23289725.
Reddappa, S.B., Aski, M.S., Mishra, G.P. et al. QTL mapping for yield contributing traits in mungbean (Vigna radiata L.) using a RIL population. Sci Rep 15, 20795 (2025).
Address:Registered Office: 150, Patparganj Industrial Area, New Delhi – 110092, India
Operational Address:National Institute of Plant Genome Research (BRIC - NGGF)
Lab No. 206 and 207, Aruna Asaf Ali Marg, P.O. Box No. 10531,
New Delhi – 110067, India