Amplicon Sequencing Services
Home
> Amplicon Sequencing Services
Amplicon Sequencing Services: High-Resolution Genetic and Microbiome Analysis
At N2 Jenomics Lab Pvt. Ltd. , we offer high-throughput and flexible amplicon sequencing solutions for accurate detection of genetic variations within targeted genomic regions. This service is ideal for a wide range of research applications, including variant screening, microbial diversity profiling, and genome editing validation.
Key Advantages
Compatible with various sample types and amplicon lengths
Ultra-deep sequencing for exceptional sensitivity and specificity
Customizable data output and bioinformatics workflows
End-to-end service with fast and responsive technical support
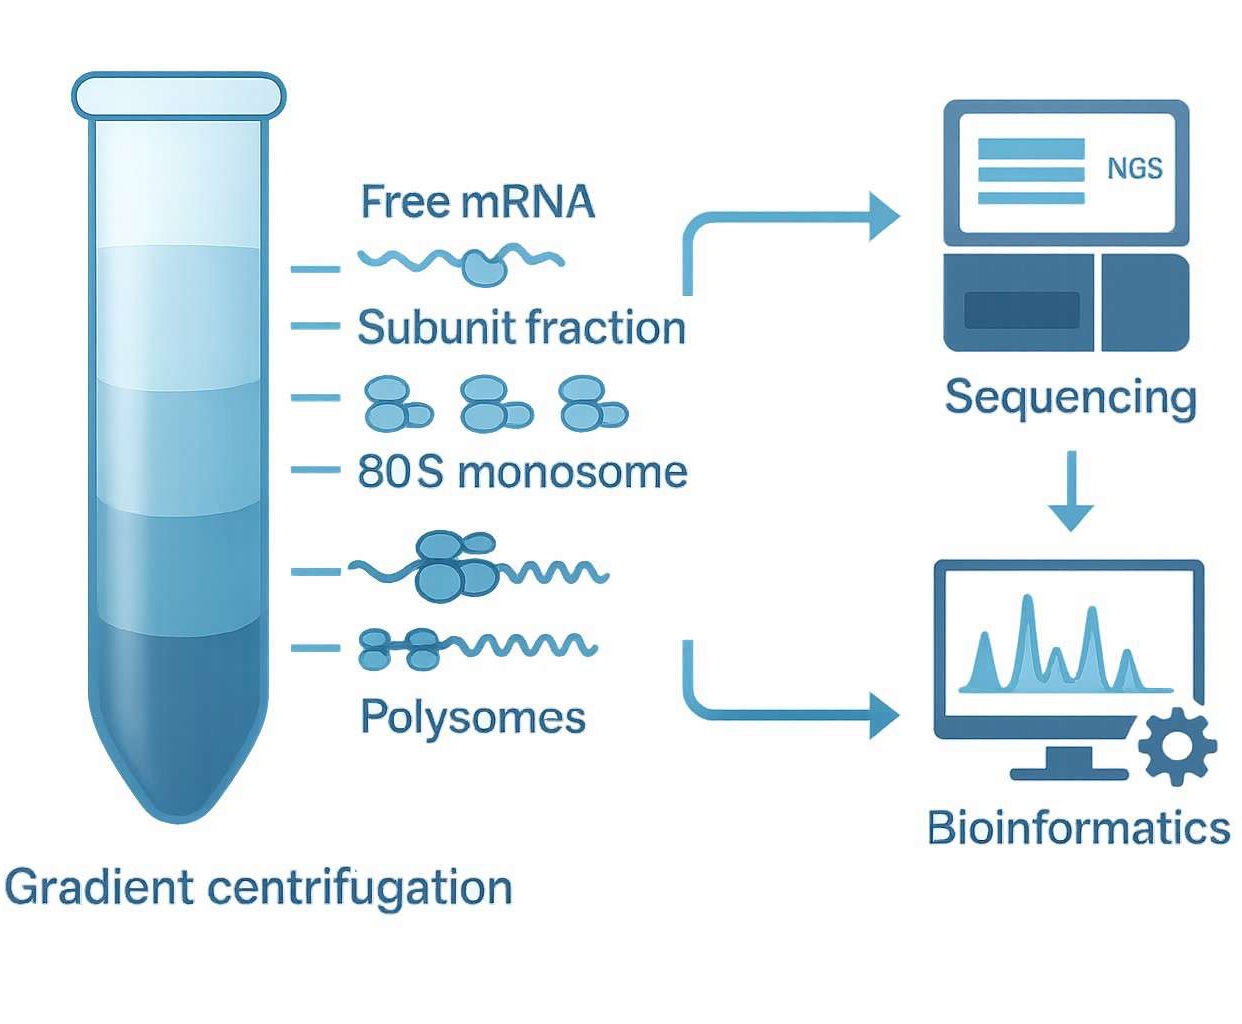
Amplicon sequencing is a targeted next-generation sequencing (NGS) approach that uses specifically designed primers to amplify selected genomic regions via PCR, followed by high-throughput sequencing of the amplicons. This technique enables precise detection of genetic variants within defined loci and is widely used in studies of gene mutations, microbial diversity, and biomarker screening.
How It Works
Target Selection & Primer Design – Primers are designed to amplify specific genomic regions of interest based on research objectives.
PCR Amplification – The target regions are amplified from sample DNA to generate high-abundance amplicons.
Library Construction & Sequencing – Amplicons are ligated with adapters and prepared into sequencing libraries, then sequenced using platforms such as Illumina or PacBio.
Data Analysis – Sequencing data are processed for alignment, variant calling, sequence assembly, or taxonomic classification.
This method is ideal for high-throughput detection of mutations across multiple samples, enabling the simultaneous interrogation of hundreds to thousands of amplicon loci.
Why Use Amplicon Sequencing
Amplicon sequencing is a highly efficient and cost-effective targeted sequencing approach ideal for in-depth analysis of specific genomic regions, microbial communities, or functional gene elements. N2 Jenomics Lab Pvt. Ltd. provides comprehensive, customizable amplicon sequencing solutions—supporting your research from primer design to bioinformatics analysis.
Highly Targeted & Accurate By amplifying only the regions of interest with specific primers, this method ensures precise variant detection with high sensitivity—ideal for locus-specific validation and functional studies.
High Throughput & Multiplexing Capable of analyzing hundreds to thousands of target regions per run, making it suitable for large-scale screening, microbial diversity profiling, and parallel sample processing.
Platform Flexibility & Broad Amplicon Range Compatible with both Illumina (short-read) and PacBio (long-read) platforms. Supports amplicons from 100 bp up to 10 kb, meeting a wide range of research needs.
Sensitive to Low-Abundance Variants With ultra-deep sequencing, it excels at detecting low-frequency somatic mutations and resolving complex microbial mixtures, ensuring key insights are not missed.
Illumina Platform: Offers high sequencing accuracy; ideal for short to mid-length amplicons. Supports high multiplexing capacity, making it well-suited for high-throughput studies.
PacBio Platform: Enables long-read, high-fidelity sequencing. Best suited for structurally complex or long amplicons requiring phasing or full-length analysis.
Recommendations:
For amplicons <250 bp, we recommend Illumina paired-end 2×150 bp sequencing.
For amplicons between 250–550 bp, we recommend Illumina 2×250 bp or 2×300 bp configurations.
For amplicons >550 bp or projects requiring full-length sequences, we recommend the PacBio platform with HiFi (High-Fidelity) reads for single-molecule accurate sequencing.
Our Amplicon Sequencing Process: From Consultation to Reporting
Our modular workflow ensures standardized quality control at every step and allows flexible adjustments based on project needs:
Project Consultation
Define targets
Select sequencing platform and depth
Confirm workflow
Sample Submission & QC
Sample registration
DNA/PCR quality control
Optional PCR amplification service
Library Preparation
Adapter ligation
Indexing and pooling
Library quality check
Sequencing
Illumina or PacBio platforms
Short or long reads
Customizable sequencing depth
Bioinformatics & Reporting
Data quality control
Variant detection and taxonomic analysis
Final report delivery
Get Your Instant Quote
Research Applications of Amplicon Sequencing
Our amplicon sequencing services are widely applied across diverse research fields, enabling precise and efficient analysis of genomic variations and complex sequence information. Key application areas include:
Genetic Variant Detection Accurate identification of SNPs, somatic mutations, and complex genetic variants to support various genetic studies and genotyping.
Microbiome Research Sequencing of 16S rRNA, 18S rRNA, and ITS regions for microbial diversity analysis, phylogenetic profiling, and ecological studies.
Immune Repertoire Sequencing Targeted sequencing of antibody heavy and light chains to support immune diversity profiling and therapeutic antibody development.
Gene Editing Validation Assessment of CRISPR/Cas9 editing efficiency and off-target effects to ensure accuracy and reliability in genome editing experiments.
Functional Gene Screening High-throughput screening of specific gene regions to facilitate gene function studies and novel target discovery.
Plasmid Library Analysis Comprehensive analysis of plasmid libraries for diversity and structural features to support molecular cloning and genetic engineering.
Amplicon Sequencing Bioinformatics & Data Analysis Services
We offer comprehensive and customizable bioinformatics solutions for amplicon sequencing projects, supporting both short-read and long-read sequencing platforms. Our services help clients unlock the full value of their data and achieve accurate variant detection and functional interpretation.
Data Quality Control & Preprocessing Removal of adapter sequences and low-quality reads, paired-end read merging to ensure high-quality data.
Denoising & Variant Detection Advanced algorithms (e.g., DADA2, UNOISE) for noise removal and chimera filtering; accurate identification of SNPs and Indels.
Taxonomic Annotation & Classification High-efficiency species annotation based on 16S, 18S, ITS, and other curated databases.
Diversity Analysis Alpha and Beta diversity assessments to support microbial community structure comparison and ecological statistics.
Functional Prediction & Pathway Analysis Systematic gene function prediction to uncover potential biological functions and metabolic pathways.
Data Visualization & Reporting Rich graphical outputs and intuitive reports to facilitate in-depth understanding of sequencing results.
High-Accuracy Long Read Correction CCS (Circular Consensus Sequencing) and error-correction algorithms enhance read accuracy and data reliability.
Full-Length Amplicon Assembly Obtain complete amplicon sequences without the need for stitching, enabling accurate detection of complex and long-range variants.
Phasing & Structural Variant Detection Detect SNPs, Indels, and structural variants from full-length reads, supporting high-resolution variant phasing.
High-Resolution Taxonomic & Functional Annotation Species and gene function annotation at higher resolution based on full-length sequence alignments.
Advanced Microbial Community Profiling Leverage full-length reads for in-depth microbial community and functional diversity analysis.
Customized Reporting Deliverables include structural variation maps, full-length variant details, and comprehensive functional interpretation to support scientific publication.
Sample Requirements and Quality Guidelines for Amplicon Sequencing
To ensure high-quality sequencing results, N2 Jenomics Lab Pvt. Ltd. provides clear guidelines for sample types and input requirements. Below is a quick reference for recommended quantities and quality criteria:
Acceptable, but purification is strongly advised for optimal sequencing quality
—
Fragmented DNA
Sufficient amount
—
Requires uniform size and compatibility with target region
For specific amplicon strategies
Genomic DNA (gDNA)
≥500 ng
1.8–2.0
High purity; ≥20 ng/μL; no degradation
Ideal for PCR-based amplification
Restriction Enzyme Cuts
Adequate quantity
—
Complete digestion; free from inhibitors
Suitable for downstream library prep
Plasmids
Adequate quantity
—
Must be purified; ensure integrity of the target insert
—
💡 Note: These are general recommendations. For project-specific needs, contact our technical team for tailored guidance.
Why Choose N2 Jenomics Lab Pvt. Ltd. for Amplicon Sequencing?
N2 Jenomics Lab Pvt. Ltd. specializes in delivering high-quality, high-throughput amplicon sequencing services, leveraging advanced Illumina and PacBio platforms to meet diverse amplicon length and complexity requirements. We are committed to providing accurate and reliable variant analysis data, supporting genomic research, microbiome studies, and functional gene screening across various fields.
Multi-Platform Technology Support Comprehensive coverage from hundreds to tens of thousands of base pairs using Illumina short reads and PacBio long reads, accommodating diverse experimental designs.
Superior Data Quality and Accuracy Rigorous quality control processes ensure high coverage and deep sequencing depth for precise detection of low-frequency variants.
Customized Bioinformatics Analysis Professional sequence assembly, variant detection, and functional annotation with intuitive visualization reports to help clients rapidly extract valuable insights.
End-to-End Professional Support and Fast Response Experienced team guidance throughout project design, sample QC, sequencing, and data delivery to ensure efficient and smooth project completion.
Demo Results
Partial results are shown below:
The taxonomy distribution of all sample in Phylum classification level.
Species abundance Heatmap.
Rarefaction curve of the sequenced reads for samples (The above figure) & The depth of the sequencing samples (The below figure).
Boxplot analysis based on bray Curtis (A), binary jaccard (B), unweighted unifrac (C), and weighted unifrac (D).
PCoA analysis based on bray Curtis (A), binary jaccard (B), unweighted unifrac (C), and weighted unifrac (D).
UPGMA clustering tree.
Amplicon Seq FAQs
1. What is the difference between targeted sequencing and amplicon sequencing?
Amplicon sequencing involves the PCR amplification of specific genomic regions followed by sequencing, which ensures high specificity and on-target rates due to the precise design of primers. It is particularly suitable for analyzing small, defined regions of the genome, such as in genetic variation analysis and microbial profiling. In contrast, targeted sequencing encompasses methods like hybrid capture and probe-based enrichment to selectively sequence larger genomic regions or multiple genes without prior amplification. This allows for a more comprehensive analysis of selected areas, but may have variable on-target rates depending on the efficiency of the enrichment process. Amplicon sequencing, by its nature, achieves superior on-target rates in contrast to other targeted sequencing methodologies, attributing this efficiency to the precise design of primers. This approach finds particular applicability in tasks like genotyping via sequencing, as well as the discernment of germline single nucleotide polymorphisms (SNPs), insertions and deletions (indels), and known genetic fusions.
2. What are the primary applications of Amplicon Sequencing?
Amplicon sequencing serves as a pivotal tool in diverse scientific domains, encompassing but not limited to the following applications:
Genetic Variance Analysis: Unveiling single nucleotide polymorphisms (SNPs), insertions, deletions, and other hereditary genetic modifications.
Microbiome Investigations: Profiling microbial communities by sequencing marker genes like the 16S ribosomal RNA.
Oncological Inquiry: Spotting somatic mutations and genetic modifications within tumor specimens.
Hereditary Disease Research: Exploring the genetic underpinnings of inherited disorders.
Environmental Surveys: Gauging biodiversity and identifying specific organisms within environmental specimens.
3. What is the difference between Amplicon Sequencing and Whole-Genome Sequencing (WGS)?
Amplicon sequencing targets specific genomic regions by amplifying them with PCR before sequencing, allowing for high specificity and depth in analyzing small, defined regions, such as in detecting mutations or profiling microbial communities. In contrast, whole-genome sequencing (WGS) sequences the entire genome without prior selection or amplification, providing a comprehensive view of all genetic information, which is ideal for discovering novel variants and obtaining a complete genetic profile, but it is more resource-intensive and less focused on specific areas of interest.
4. How do you choose the target regions for Amplicon Sequencing?
The selection of target segments in Amplicon Sequencing hinges on the study's objectives and the biological significance of these segments. Pertinent factors include associations with diseases, genetic markers, regions of notable variability, and functional relevance. Collaborating with bioinformaticians and utilizing databases like dbSNP and ClinVar can facilitate precise target region identification.
5. What types of bioinformatic analyses can be performed with Amplicon Sequencing data?
Variant identification: Recognizing SNPs, insertions, deletions, and diverse genetic variances.
Analysis of microbial diversity: Evaluating the constitution and prevalence of microbial consortia.
Phylogenetic investigation: Researching evolutionary connections among sequences.
Functional elucidation: Associating genetic variances with plausible functional implications.
6. Can Amplicon Sequencing detect rare variants?
Without a doubt, Amplicon Sequencing displays notable sensitivity, allowing the detection of infrequent variants found at low occurrences. This trait renders it applicable for situations like the spotting of mutations in cancer and the evaluation of microbial diversity.
7. How does N2 Jenomics Lab Pvt. Ltd. ensure sequencing success with high-GC content regions?
We use a 3-layer strategy to maximise yield and accuracy:
Optimised Library Prep: Methylation-adaptive polymerases reduce GC bias during amplification.
Bioinformatics Correction: Advanced algorithms compensate for GC-skewed abundance in downstream data.
Amplicon Seq Case Studies
Customer Publication Highlight
Microbial adaptation and response to high ammonia concentrations and precipitates during anaerobic digestion under psychrophilic and mesophilic conditions
Journal: Water Research
Published: 1 October 2021
DOI: https://doi.org/10.1016/j.watres.2021.117596
Background
High ammonia concentrations (TAN >1.5 g/L) are a major cause of methane inhibition in anaerobic digestion (AD), particularly under mesophilic (37°C) and psychrophilic (22.6°C) conditions. Phosphate precipitates (e.g., struvite) further exacerbate system collapse, reducing methane yield by >50%. This study pioneers the exploration of microbial ammonia adaptation mechanisms in psychrophilic reactors and analyzes the long-term impact of precipitates on methanogenic communities.
Project Objectives
Microbial Adaptation: Uncover microbial responses to high TAN (4,000 mg/L) in psychrophilic vs. mesophilic AD.
Key Consortium Identification: Identify ammonia-tolerant methanogens and precipitate-sensitive taxa.
Functional Dynamics: Link metagenomic shifts to methane metabolism pathways.
N2 Jenomics Lab Pvt. Ltd. ’ Services
As the core genomics partner, N2 Jenomics Lab Pvt. Ltd. delivered:
16S rRNA Amplicon Sequencing Platform: Illumina MiSeq PE300 Target Region: V4-V5 hypervariable (optimized for Archaea detection). Primers: 515F (5′-GTGYCAGCMGCCGCGGTAA) / 926R (5′-CCGYCAATTYMTTTRAGTTT). Data Depth: ~30,000 reads/sample (covering all TAN adaptation phases).
Whole-Genome Metagenomic Sequencing Platform: Illumina NovaSeq PE150. Depth: 6 GB raw data/sample (initial vs. endpoint samples). DNA Standards: Concentration ≥50 ng/μL, 260/280 ratio <1.8.
Figure 3. Alpha diversity and methane yield in experimental reactors at different ammonia concentrations (a) psychrophilic reactor (R1-CO) and (b) mesophilic reactor (R2-WW).
Figure 4. Bacteria and Archaea profiles from 16S rRNA amplicon data along with the step-by-step increase in ammonia levels.
Figure 5. (a) Relative abundance of Archaea Domain, and (b) number of hits for Bacteria and Archaea Domain in psychrophilic (R1-CO) and mesophilic (R2-WW) AD.
Figure 8. Number of genes copy for methane metabolism (anabolism and catabolism) using KEGG Database.
Implications
Process Optimization: Enriching Methanocorpusculum in psychrophilic AD enhances ammonia tolerance, reducing heating energy demands.
Operational Address:National Institute of Plant Genome Research (BRIC - NGGF)
Lab No. 206 and 207, Aruna Asaf Ali Marg, P.O. Box No. 10531,
New Delhi – 110067, India