TCR-Seq and BCR-Seq for Immune Repertoire Profiling
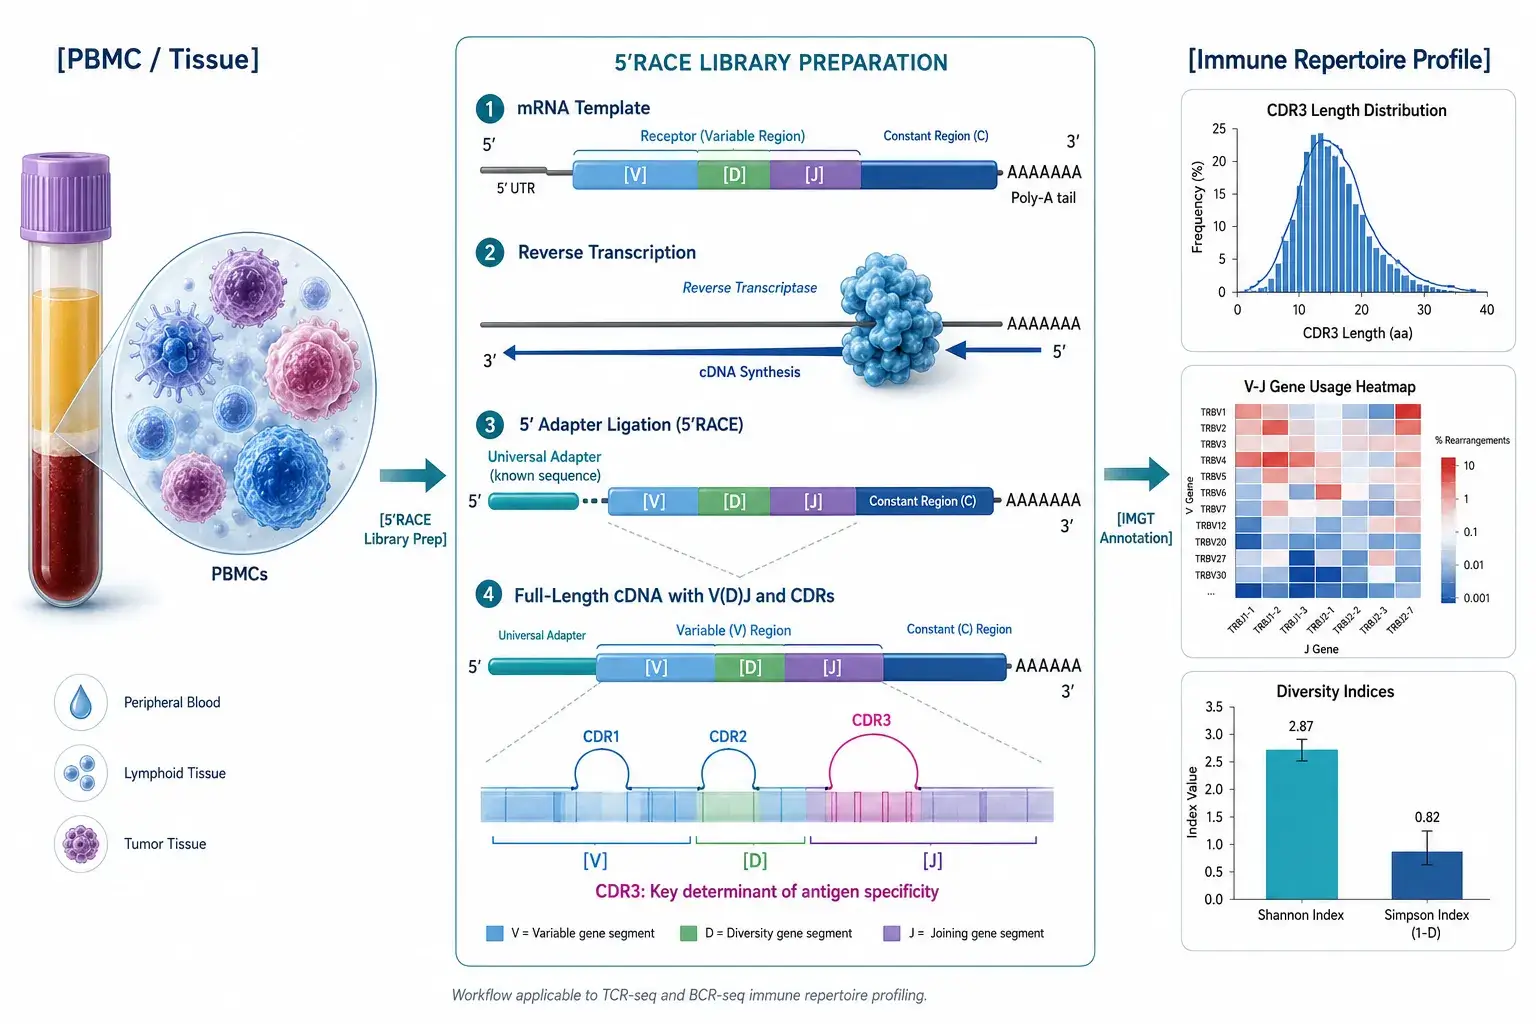
T-cell receptors (TCRs) and B-cell receptors (BCRs) are the molecular sensors of adaptive immunity. Our 5'RACE-based TCR and BCR immune repertoire sequencing service profiles the composition, diversity, and clonal architecture of the adaptive immune response — capturing the complete V(D)J variable region (CDR1, CDR2, CDR3) for comprehensive repertoire analysis.
5'RACE-based library preparation captures complete V(D)J region (CDR1/2/3)
Coverage for TRA, TRB, TRG, TRD and IGH, IGK, IGL chains
IMGT-aligned clonotype annotation and repertoire analysis
Quantitative metrics: clonality, diversity, V-J usage, CDR3 distribution
RNA or gDNA input options with expert selection guidance
T-cell receptors (TCRs) and B-cell receptors (BCRs) are the molecular sensors of adaptive immunity. Each T or B cell carries a unique receptor generated through V(D)J recombination — a process that rearranges variable (V), diversity (D), and joining (J) gene segments to create a diverse repertoire capable of recognizing a vast array of antigens. TCR and BCR immune repertoire sequencing profiles this collection of receptors in a sample, revealing the composition, diversity, and clonal architecture of the adaptive immune response. The complementarity-determining region 3 (CDR3) — the most variable part of each receptor — serves as a molecular tag for individual T- and B-cell clones.
What this service provides:
5'RACE-based library preparation — Captures the complete V(D)J variable region, including CDR1, CDR2, and CDR3
IMGT-based V(D)J annotation: reads aligned to the international IMGT reference database for standardized clonotype identification.
The IMGT database (imgt.org) is the international reference for immunoglobulin and T-cell receptor gene annotation, providing standardized clonotype nomenclature across studies [1].
5'RACE vs Multiplex PCR — Method Comparison
Two main approaches are used for TCR/BCR library preparation: 5' Rapid Amplification of cDNA Ends (5'RACE) and multiplex PCR (mPCR). Choosing the right method affects which receptor regions are captured and how faithfully the repertoire is represented.
Dimension
5'RACE
Multiplex PCR
Region captured
Complete V(D)J (CDR1, CDR2, CDR3)
CDR3 only
Amplification bias
Low — single primer pair with universal adapter
Moderate to high — multiple primer pairs with varying efficiencies
Quantification accuracy
Higher — fewer amplification rounds, less primer competition
Lower — primer-specific biases can distort clone frequencies
Why we use 5'RACE: The 5'RACE method adds a universal adapter to the 5' end of cDNA during reverse transcription, enabling amplification with a single primer pair instead of a multiplex primer pool. This reduces amplification bias and captures the full V(D)J region — CDR1, CDR2, and CDR3 — rather than just the CDR3 loop. Complete V(D)J information supports V(D)J gene usage analysis, somatic hypermutation detection in BCR, and more accurate clonotype identification [2].
Multiplex PCR is a viable alternative when only CDR3-level information is needed, but it introduces primer-specific amplification bias that can skew clone frequency estimates. For studies requiring accurate clonal abundance, full V(D)J annotation, or low-input capability, 5'RACE delivers more complete and quantitative results.
RNA vs DNA Input — Selection Guide
TCR/BCR repertoire sequencing can start from RNA or genomic DNA (gDNA). Each has distinct implications for what the data represents.
Dimension
RNA Input
gDNA Input
What is measured
Expressed TCR/BCR transcripts
Genomic V(D)J rearrangements
Clone frequency
Reflects expression level — one cell may produce multiple transcript copies
One template per cell — closer to actual clone size
CDR region coverage
Full V(D)J (CDR1, CDR2, CDR3) with 5'RACE
Typically CDR3 only — introns between V/D/J segments limit full-length PCR
Somatic hypermutation (SHM)
Detectable in BCR transcripts
Detectable but requires more complex analysis
Input requirement
~1–100 ng total RNA
Typically ≥2 µg gDNA
FFPE compatibility
Challenging — RNA degrades in FFPE
More suitable — DNA is relatively stable in FFPE
Guidance:
Choose RNA for comprehensive repertoire profiling with full V(D)J annotation, SHM analysis, and when working with limiting input material.
Choose gDNA for archival FFPE samples, when avoiding transcript-level expression bias is critical, or when only CDR3-level clonality assessment is needed.
Our standard service uses RNA input with 5'RACE. A gDNA-based option is available upon consultation.
TCR and BCR Sequencing Workflow
The service follows six connected steps, with quality control at key transitions.
1. Sample Receipt and QC
Total RNA is extracted (when starting from cells or tissue) and assessed for concentration (≥10 ng/µL), purity (A260/A280 ≥1.8), and integrity (RIN ≥7 recommended). Samples passing QC proceed to library preparation.
2. Library Preparation (5'RACE)
Reverse transcription primes from the constant region of TCR (TRAC/TRBC) or BCR (IGH/IGK/IGL) transcripts. A universal adapter is ligated to the 5' end of cDNA, enabling single-primer-pair amplification of the complete V(D)J region. Transcript-specific barcodes may be incorporated for duplicate marking and error correction.
3. Sequencing
Libraries are sequenced on the Illumina platform (MiSeq PE300 or HiSeq PE150/250 configuration). Paired-end reads span the CDR3 region and extend into V and J gene segments for complete clonotype assembly.
4. Basecalling and Raw Data QC
Raw sequencing reads are filtered by quality score (Q30 target), trimmed of adapter sequences, and checked for read-pair concordance. Read counts per sample are recorded.
5. IMGT Alignment and Clonotype Assembly
Quality-filtered reads are aligned to the IMGT reference database for V, D, and J gene assignment. CDR3 nucleotide and amino acid sequences are identified, and clonotypes are assembled by unique CDR3 sequence + V-J combination.
6. Repertoire Analysis and Data Delivery
Clonotype tables are processed for diversity metrics, V-J gene usage, CDR3 length distribution, and clonality assessment. Results are compiled into a structured report and delivered with raw data files.
Clonotype frequency tables (Excel and tab-delimited format); IMGT alignment summary (V/D/J gene assignment per clonotype); CDR3 nucleotide and amino acid sequences
Visual results
CDR3 length distribution plot; V-J gene usage heatmap; Diversity metric bar charts (Shannon, Simpson, clonality); Clonotype rank-abundance curve
Documentation
Full analysis report (PDF) with methods, parameters, and interpretation notes; Project metadata file (sample IDs, sequencing configuration, analysis software versions)
All files are delivered via secure data transfer or hard drive, per customer preference.
Applications of TCR and BCR Sequencing
Cancer Immunology
Profile tumor-infiltrating lymphocyte (TIL) repertoires to assess anti-tumor immune responses, identify expanding T-cell clones, and correlate repertoire features with immunotherapy outcomes. BCR analysis reveals intra-tumoral B-cell responses and antibody repertoire shifts.
Related:single-cell TCR/BCR sequencing service
Infectious Disease Research
Track antigen-specific T- and B-cell clonal expansion during acute infection and convalescence. Identify public clonotypes shared across individuals responding to the same pathogen.
Vaccine Development
Assess vaccine-induced clonal expansion, repertoire diversification, and memory B-cell persistence. Compare pre- and post-vaccination repertoires to evaluate immunogenicity and durability.
Autoimmune Disease
Characterize T- and B-cell repertoire skewing in autoimmune conditions. Identify disease-associated clonotypes and assess repertoire changes following immunomodulatory therapy.
Transplantation
Monitor donor-reactive T-cell clones and assess repertoire reconstitution following hematopoietic stem cell transplantation or solid organ transplant.
Identify repertoire-level signatures — clonality, diversity, specific V-J usage patterns — that correlate with disease state, treatment response, or prognosis across patient cohorts.
Reference
Giudicelli V, Chaume D, Lefranc MP. IMGT/GENE-DB: a comprehensive database for human and mouse immunoglobulin and T cell receptor genes. Nucleic Acids Research. 2005;33(Database issue):D256–D261. https://doi.org/10.1093/nar/gki010
Rosati E, Dowds CM, Liaskou E, Henriksen EKK, Karlsen TH, Franke A. Overview of methodologies for T-cell receptor repertoire analysis. BMC Biotechnology. 2017;17(1):61. https://doi.org/10.1186/s12896-017-0379-9
Frank ML, Lu K, Erdogan C, et al. T-cell receptor repertoire sequencing in the era of cancer immunotherapy. Clinical Cancer Research. 2023;29(6):994–1008. https://doi.org/10.1158/1078-0432.CCR-22-2469
Li R, Wang J, Li X, et al. T-cell receptor sequencing reveals hepatocellular carcinoma immune characteristics according to Barcelona Clinic liver cancer stages within liver tissue and peripheral blood. Cancer Science. 2024;115(1):94–108. https://doi.org/10.1111/cas.16013
Xie S, Yan R, Zheng A, Shi M, et al. T cell receptor and B cell receptor exhibit unique signatures in tumor and adjacent non-tumor tissues of hepatocellular carcinoma. Frontiers in Immunology. 2023;14:1161417. https://doi.org/10.3389/fimmu.2023.1161417
Bolotin DA, Poslavsky S, Mitrophanov I, et al. MiXCR: software for comprehensive adaptive immunity profiling. Nature Methods. 2015;12(5):380–381. https://doi.org/10.1038/nmeth.3364
For Research Use Only. Not for use in diagnostic procedures. All analysis results are for research investigation and should be interpreted by qualified researchers within the context of the experimental design.
Demo Results
Below are representative data types generated during a standard TCR/BCR immune repertoire sequencing project using the 5'RACE workflow. All figures are illustrative examples; results vary by sample type, species, and experimental conditions.
Figure 1: CDR3 Length Distribution A Gaussian-like distribution of CDR3 amino acid lengths, typically centered around 12–16 amino acids for TRA/TRB chains. This distribution reflects the natural V(D)J recombination process and serves as a quality indicator. Representative figure type as described in Frank et al. 2023.
Figure 2: V-J Gene Usage Heatmap Two-dimensional heatmap with V gene segments (rows) and J gene segments (columns). Color intensity represents the frequency of each V-J pairing. Uneven V-J usage is expected and reflects thymic selection, MHC restriction, and antigen-driven expansion.
Figure 3: Clonality and Diversity Metrics Bar chart comparing Shannon entropy, Simpson index, and clonality score across sample groups. High Shannon entropy indicates a polyclonal repertoire; high clonality indicates oligoclonal expansion — common in tumor-infiltrating lymphocytes or post-vaccination responses.
Reference
Frank ML, Lu K, Erdogan C, et al. T-cell receptor repertoire sequencing in the era of cancer immunotherapy. Clinical Cancer Research. 2023;29(6):994–1008. https://doi.org/10.1158/1078-0432.CCR-22-2469
For Research Use Only. Not for use in diagnostic procedures. All analysis results are for research investigation and should be interpreted by qualified researchers within the context of the experimental design.
TCR and BCR Sequencing FAQ
1. Which chains do you cover?
For TCR: TRA (α), TRB (β), TRG (γ), and TRD (δ). For BCR: IGH (heavy chain), IGK (kappa light chain), and IGL (lambda light chain). Multiple chains can be amplified in the same 5'RACE reaction.
2. Can you sequence both TCR and BCR from the same sample?
Yes. The 5'RACE workflow can amplify TCR and BCR transcripts from a single RNA sample. This is efficient when both T-cell and B-cell repertoire information is needed, such as in tumor microenvironment or vaccine response studies.
3. What sequencing depth do I need?
For standard clonality and diversity assessment, 2–5 million reads per chain is typically sufficient. For rare clonotype detection or in-depth repertoire characterization, higher depth may be recommended. Our team can advise based on your study design.
4. What species do you accept?
Human and mouse are standard. Other species (rat, non-human primate, etc.) can be accommodated with customized primer design. Contact us to discuss your species of interest.
5. Can I submit FFPE samples?
FFPE samples can be submitted for gDNA-based TCR/BCR analysis. RNA-based 5'RACE may have reduced success with FFPE due to RNA degradation. We recommend contacting us before FFPE submission so we can advise on the most suitable approach.
6. How do I choose between RNA and gDNA input?
RNA input (5'RACE) captures complete V(D)J regions (CDR1/2/3) and reflects transcript-level expression — suitable for comprehensive profiling. gDNA input avoids expression-level bias (one template per cell) but is typically limited to CDR3-level analysis. Choose based on your research question: transcript-level repertoire with full annotation (RNA) or cell-level quantification with CDR3 focus (gDNA).
7. Can clonotypes be tracked across multiple timepoints?
Yes. Clonotype tracking across longitudinal samples is available as an optional add-on. Clonotypes from different timepoints are matched by CDR3 nucleotide sequence identity, and frequency changes are quantified to identify expanding or contracting clones.
8. What bioinformatics tools do you use for repertoire analysis?
Our standard pipeline uses MiXCR for clonotype assembly and IMGT/HighV-QUEST for V(D)J gene annotation against the IMGT reference database. Custom analysis scripts handle additional metrics, visualization, and longitudinal tracking.
For Research Use Only. Not for use in diagnostic procedures. All analysis results are for research investigation and should be interpreted by qualified researchers within the context of the experimental design.
Case Study: Immune Repertoire Signatures in Hepatocellular Carcinoma
Open Access Publication Highlight
T cell receptor and B cell receptor exhibit unique signatures in tumor and adjacent non-tumor tissues of hepatocellular carcinoma
Journal: Frontiers in Immunology (IF 5.7) Published: 2023 License: CC BY 4.0
Background
Hepatocellular carcinoma (HCC) is a leading cause of cancer-related death worldwide. The landscape of infiltrating T and B cells and their receptor repertoires in HCC remains incompletely characterized. Understanding how TCR and BCR features differ between tumor and adjacent non-tumor tissue can inform immunotherapy strategies and biomarker development.
Methods
Xie, Yan, Zheng, Shi et al. (2023) performed multi-omics profiling of paired tumor and adjacent non-tumor liver tissues from 64 treatment-naive HCC patients. The study combined bulk TCR/BCR sequencing (5'RACE + Illumina HiSeq3000 PE150, processed with MiXCR v3.0.13), bulk RNA-seq, whole-exome sequencing, and HLA sequencing. Repertoire richness was assessed by unique clonotype count; evenness by normalized Shannon diversity entropy (NSDE); similarity between paired samples by the Morisita-Horn similarity index (MHSI).
Results
TCR and BCR features differed between tissue compartments. BCR IgH and TRG richness and evenness were significantly higher in non-tumor tissues versus paired tumor tissues. BCR somatic hypermutation (SHM) was also higher in non-tumor tissues, indicating sustained B-cell responses outside the tumor.
BCR repertoires diverged more between compartments than TCR repertoires. T-cell clones were more evenly distributed across both compartments, while B-cell clones showed stronger compartment-specific expansion.
Immune repertoire features declined with HCC progression. TRB richness and evenness decreased from early-stage (TNM 1) to advanced-stage (TNM 2+) tumors. Conversely, BCR SHM intensified in advanced-stage disease.
Repertoire metrics correlated with survival. Higher immune repertoire evenness in tumor tissues and lower TCR richness in non-tumor tissues were associated with better overall survival, progression-free survival, and recurrence-free survival.
TCR and BCR repertoire features distinguish tumor and adjacent non-tumor tissues in HCC. Adapted from Xie et al., Frontiers in Immunology, 2023, under CC BY 4.0 license.
Conclusion
This study demonstrated that bulk TCR/BCR immune repertoire sequencing resolves compartment-specific immune signatures in HCC — distinguishing tumor from non-tumor tissue, tracking repertoire changes with disease progression, and identifying features associated with patient prognosis. The results highlight the value of simultaneous TCR and BCR profiling for cancer immune microenvironment characterization and biomarker discovery.
Reference
Xie S, Yan R, Zheng A, Shi M, et al. T cell receptor and B cell receptor exhibit unique signatures in tumor and adjacent non-tumor tissues of hepatocellular carcinoma. Frontiers in Immunology. 2023;14:1161417. https://doi.org/10.3389/fimmu.2023.1161417
For Research Use Only. Not for use in diagnostic procedures. All analysis results are for research investigation and should be interpreted by qualified researchers within the context of the experimental design.
Address:Registered Office: 150, Patparganj Industrial Area, New Delhi – 110092, India
Operational Address:National Institute of Plant Genome Research (BRIC - NGGF)
Lab No. 206 and 207, Aruna Asaf Ali Marg, P.O. Box No. 10531,
New Delhi – 110067, India